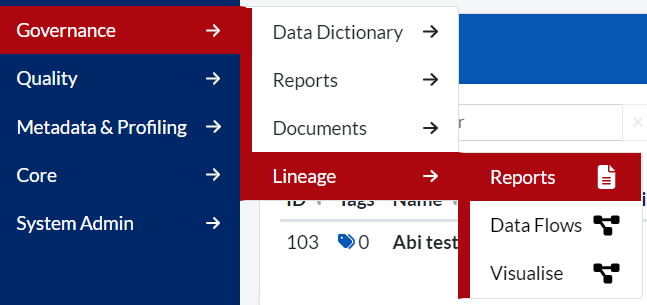
Any reports the business uses, whether regulatory reports for regular submission or reports run and used internally, can be defined in the ‘Reports’ page of Aperture Governance Studio. Any data fields which contribute to a report can then be allocated to the defined report. This can be found in Governance > Lineage > Reports:
You will be presented with the following screen:
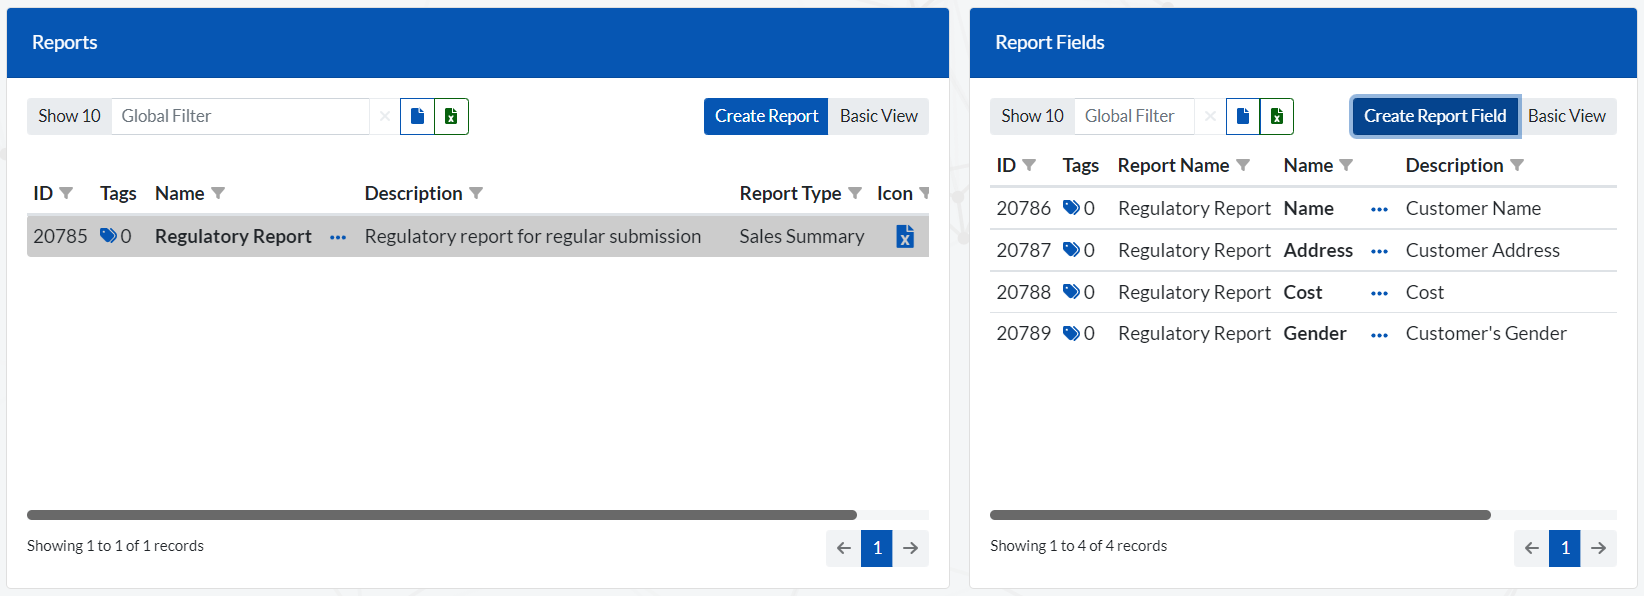
Reports are defined on the left-hand side of the screen, while the report fields which make up that report are defined on the right-hand side of the screen.
To add a report, click on ‘Create Report’ in the top right-hand corner of the ‘Reports’ window.
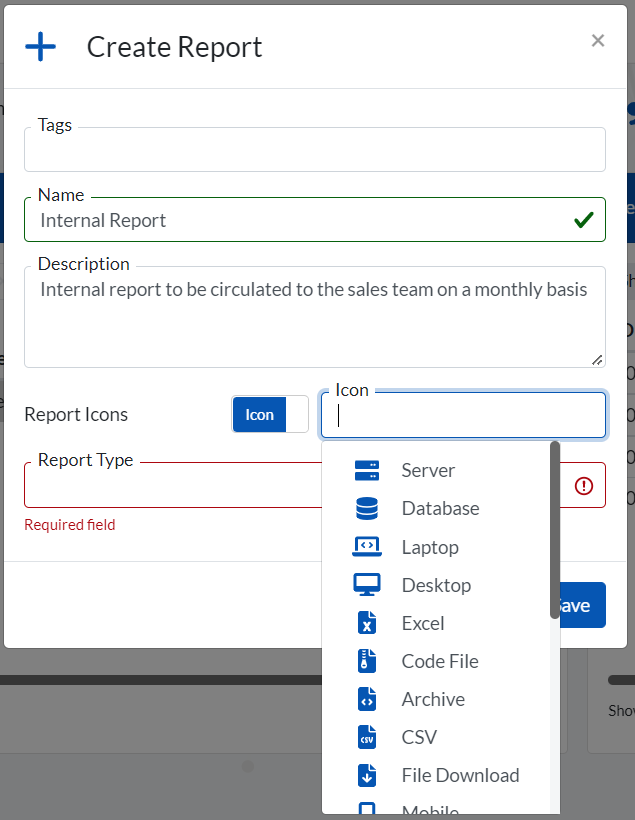
Remember to SAVE.
Once you have defined your report, you can add the necessary fields or attributes which make up that report.
To view, edit or delete a report you have defined, click on the ellipse next to the report name and select an option.
To add an attribute, click on ‘Create Report Field’ in the top right-hand corner of the ‘Report Fields’ window. You will be presented with the following window:
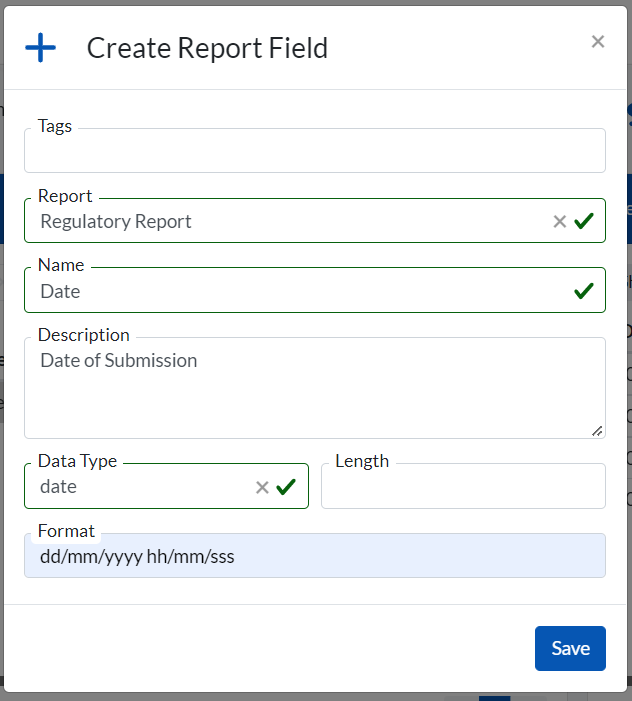
To view, edit or delete a report field you have defined, click on the ellipse next to the report name and select an option.
The reports and attributes defined here can be used within the lineage functionality to create a visualisation.
These are groupings of records that provides the flexibility to apply Rules in specified circumstances only. After a Report Group has been created, Rules can be set to only run on the specified Report Group. This is done is the Rule settings.
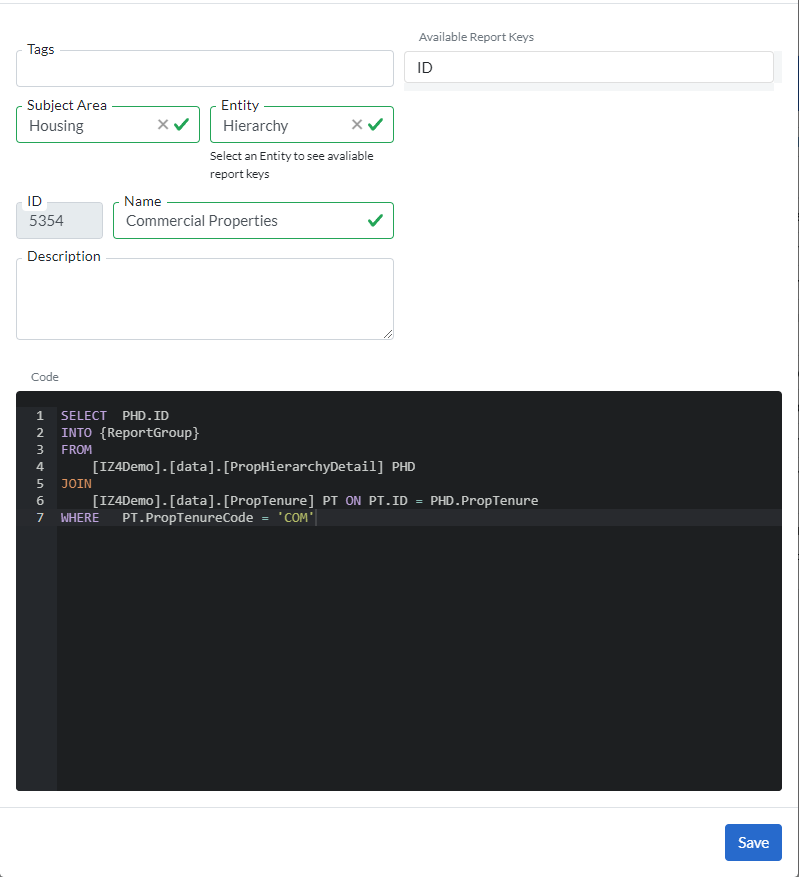
Example a Report Group could be created for ‘Commercial Properties’. The specification of the Report Groups is done via a editable SQL script which in this case would select Records that are Commercial Properties determined via a certain logic. Any Rule that has been set to ‘Commercial Properties’ as the ‘Report Group’ will run specifically on the records that are ‘Commercial properties’ as specified on the Report Group.
To navigate, go to Report Groups go to (Quality > Rules > Report Groups).
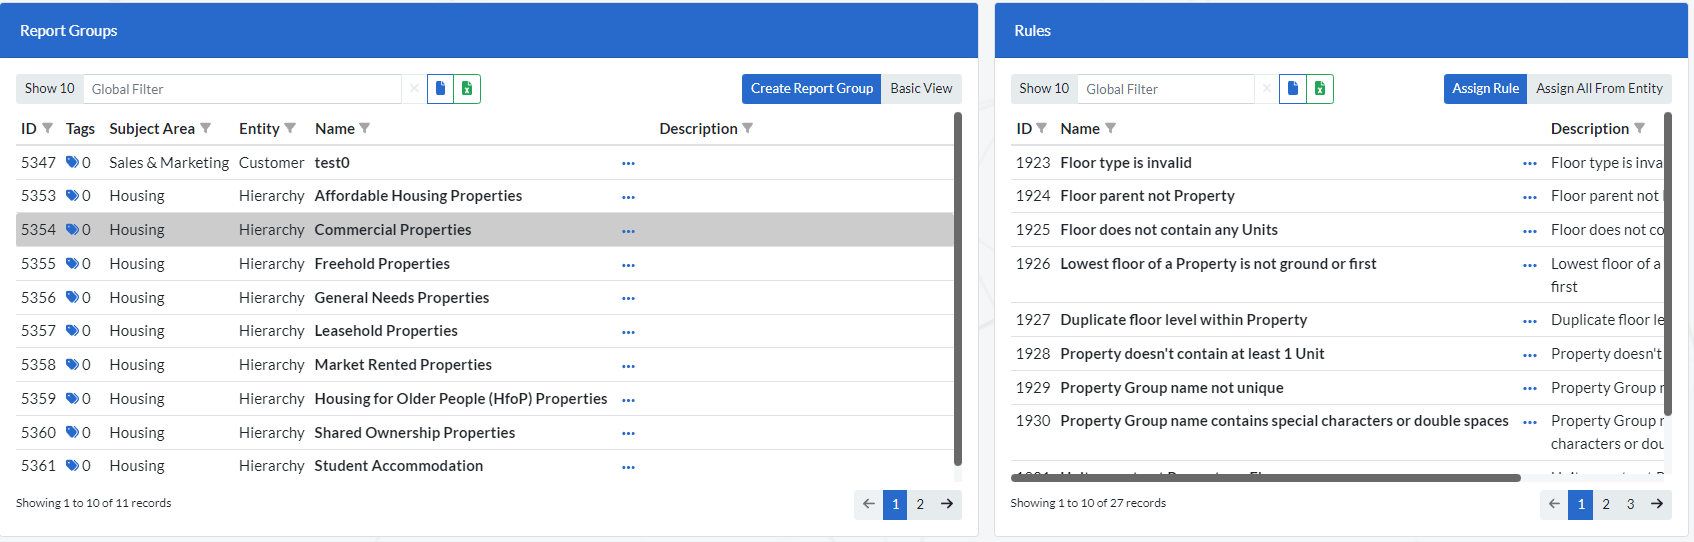
Clicking on a specific Report Group on the ‘Report Groups’ window will populate the ‘Rules Window’ will all the Rules currently attached to it.
To create a new ‘Report Group' simply click on the ‘Create Report Group’ button and you will be presented with the screen below.
Together, alongside the entity groups and extensions applied on the Entity, Rule and Rule Implementation layers, these groupings allow for a clear breakdown of errors within the Data Quality reports with their respective contexts. The best application of these features depends on the overall use case.
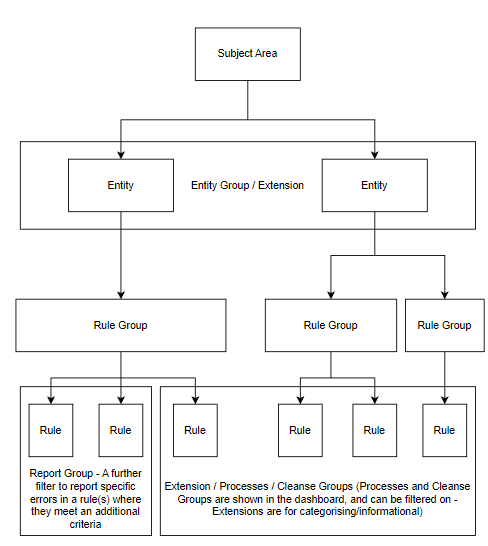
Figure describes the individual use case of the rule groupings.
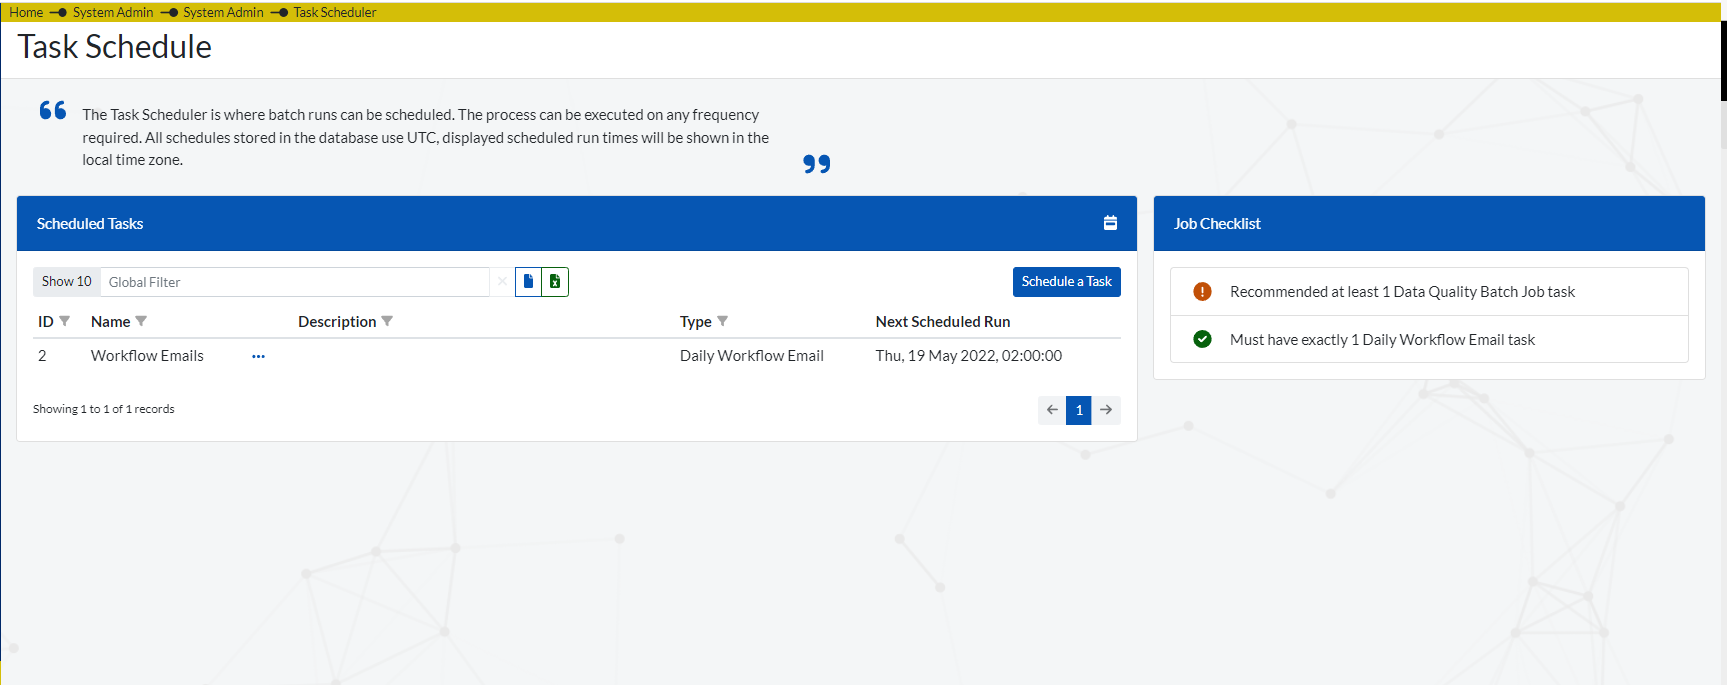
A Batch job is a scheduled task that performs the execution of all the active Rules. To set up a Batch job navigate to (System Admin > Task Scheduler ) and you will be presented with a screen (shown below) showing all available ‘Scheduled Tasks’ that have already been set up.
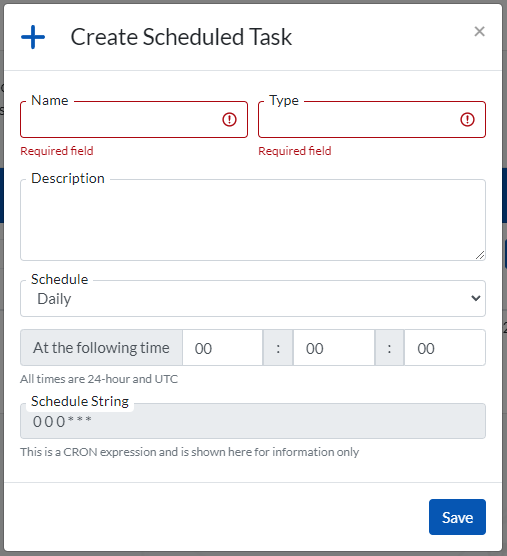
Clicking on the ‘Schedule a Task’ button will prompt a window (shown below) where you can create a new Batch job.
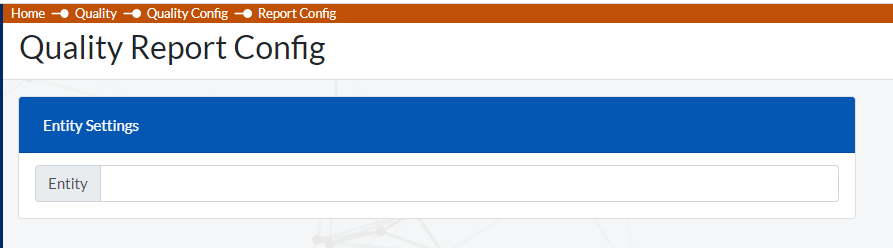
To setup the Reports and Dashboards that will provide a detailed analysis of the data quality issues identified, navigate to (Quality Report Config > Report Config ).
You will be presented with the window below in which you will be required to select the ‘Entity’ whose report you would like to setup. A report is set up for each Entity.
After selecting an Entity, several sets of screens will appear (shown below) and they include:
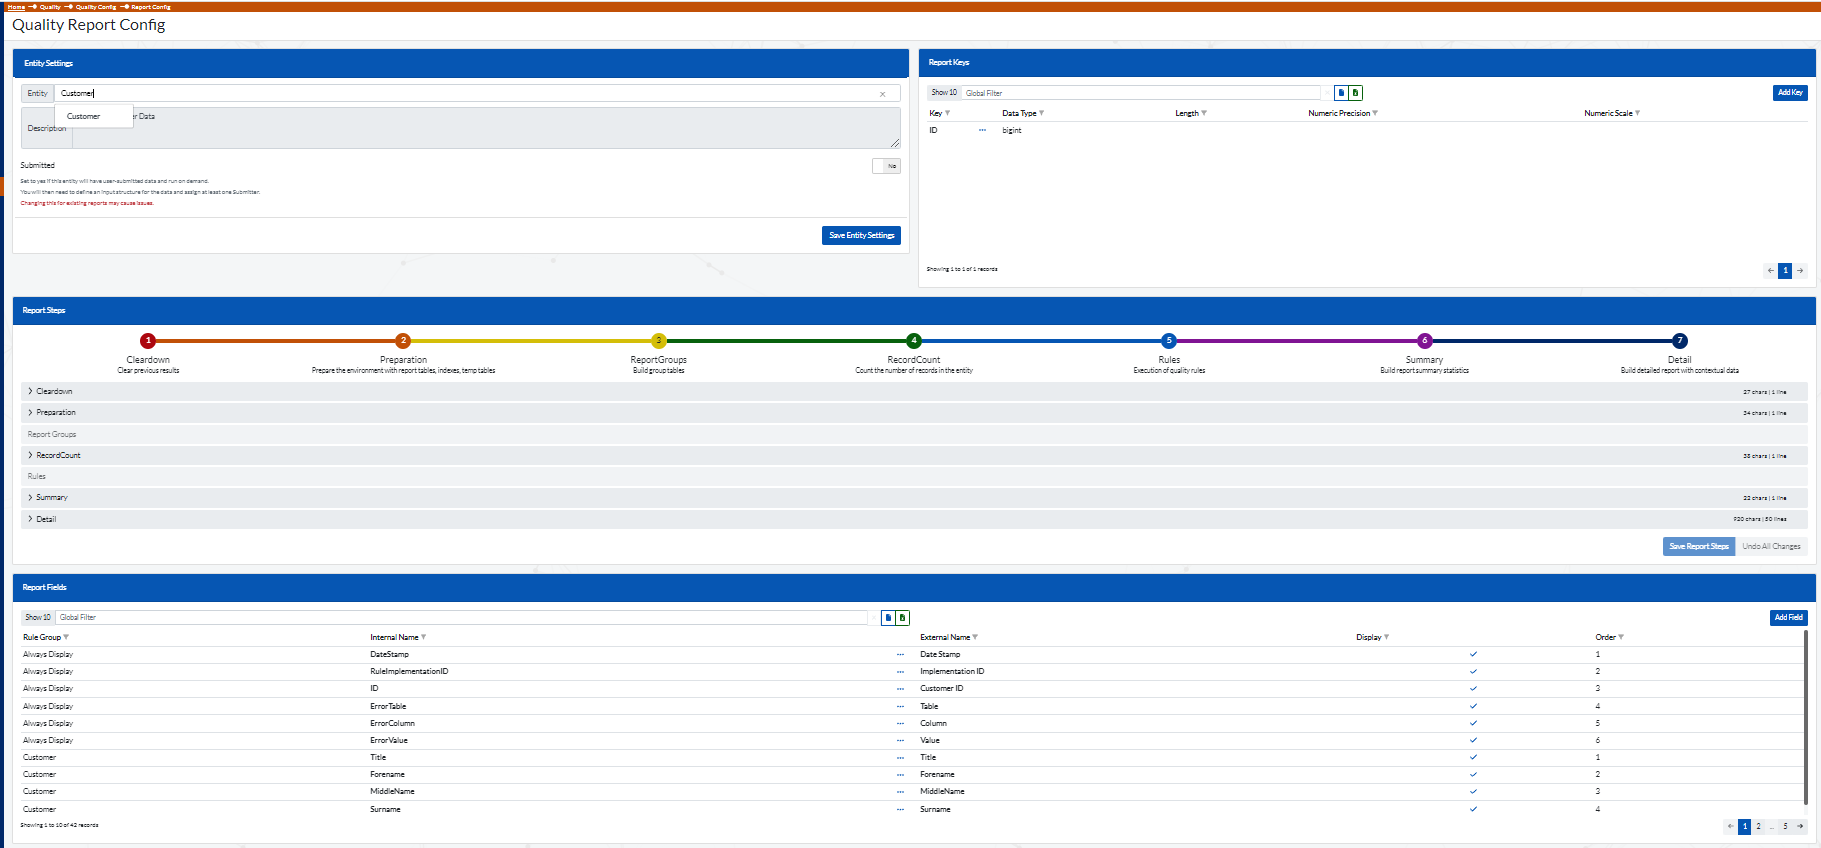
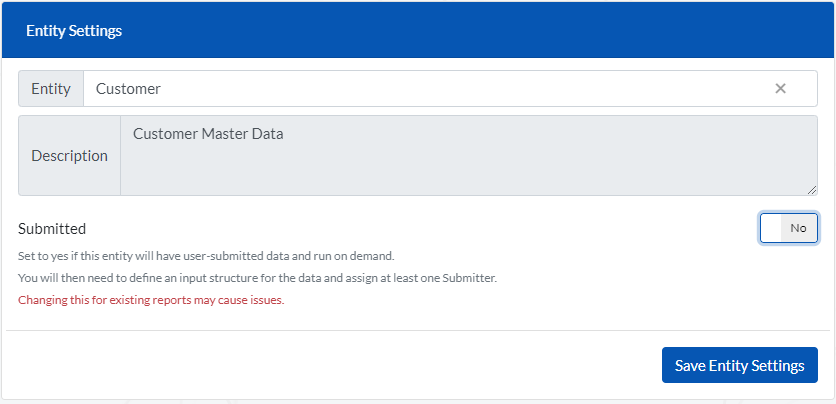
Click on the ‘Save Entity Settings’ to save the changes made in the Entity settings section so far.
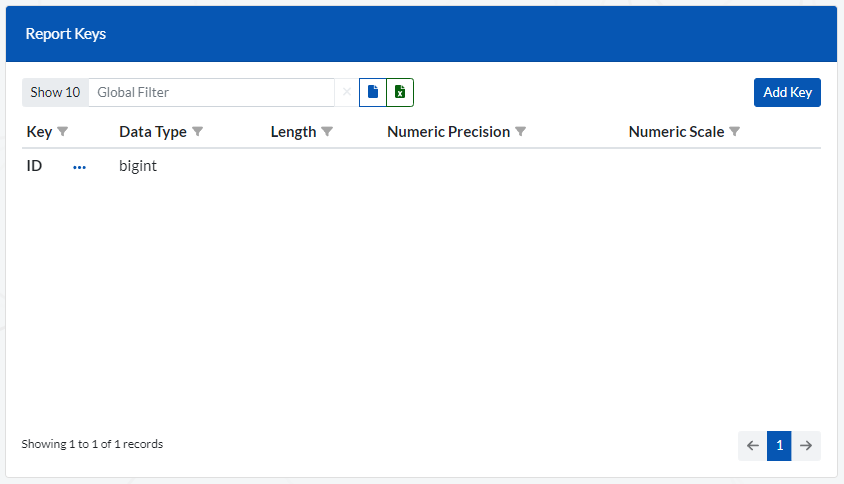
These are key fields used to breakdown the data quality reports. Ideally the ‘Keys’ added in this field are the primary keys of the tables being analyzed.
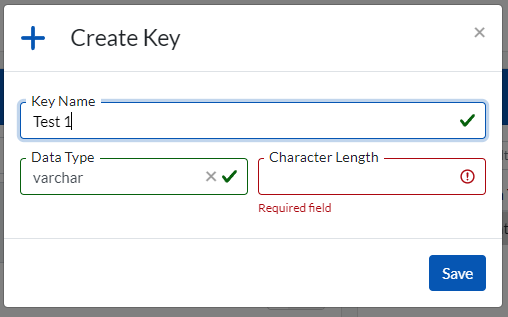
To Add a new Key simply click on the ‘Add Key’ and fill in the details accordingly on the screen below
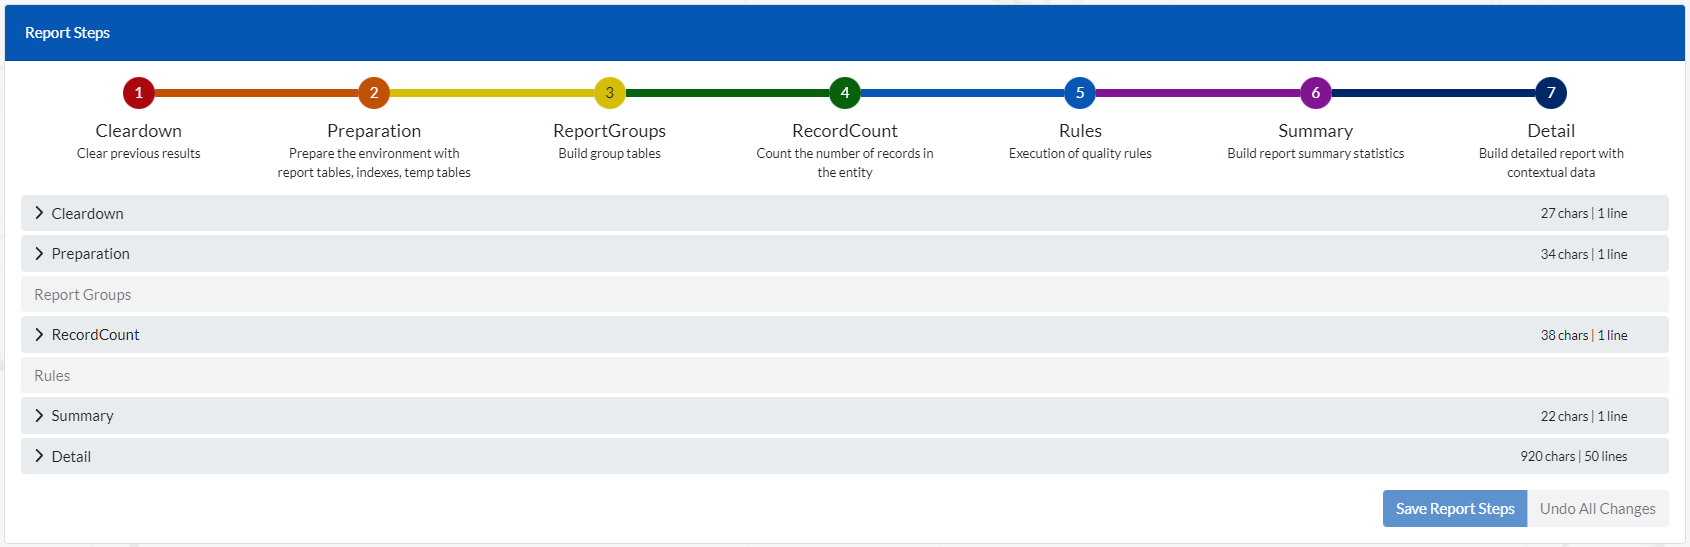
This section details the various steps taken by back end SQL scripts to produce the Data quality error reports. These steps include:
Here the users with the necessary expertise can configure the steps to suit their reporting needs.
Each step that can be configured has the ‘>’ sign before the step title. Example ‘> Cleardown’ .
To configure each step click on the Step Title and a screen showing the code behind the step will be displayed.
In the screen below the ‘Cleardown’ step has been clicked on.
![]()
Here you can adjust the script accordingly or you can run the default script by clicking on the ‘Reset to Default’ button on the top right of the window.
The same applies to the other configurable steps show on the Report steps screen ( Preparation, RecordCount, Summary, Details).
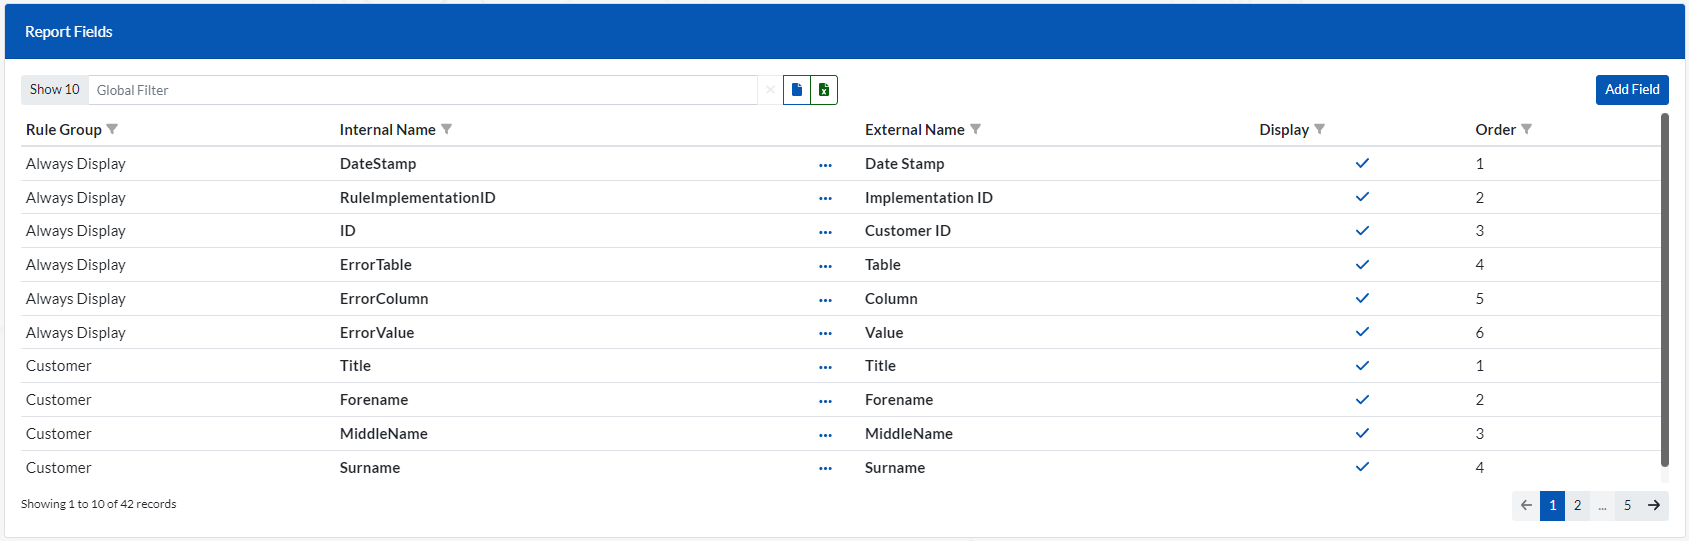
This section contains the list columns/fields that will be displayed in the data quality report. By default, the fields listed below should always be displayed.
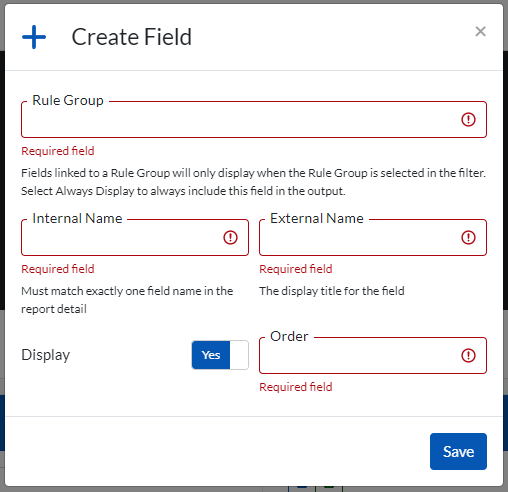
To Add new fields to be displayed in addition to the above fields, click on the ‘Add Field’ button located on the top right of the Report Fields screen. It will prompt the screen below.
To access the various dashboards and gain a visual representation of the data quality issues identified , navigate to (Reports > Dashboards).
The dashboards are updated whenever a Batch Job is executed.
The Dashboards are split into 6 sections/Tabs. They include:
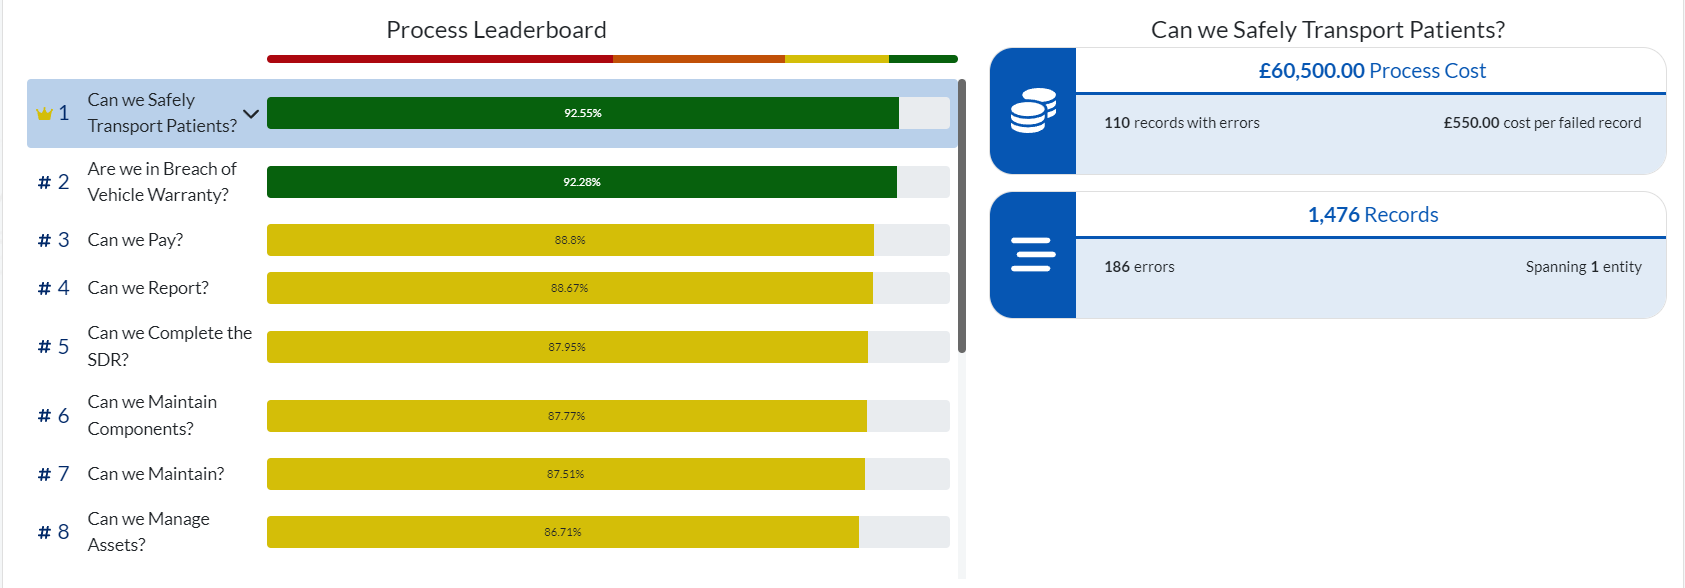
Provides an overview analysis of the data quality.
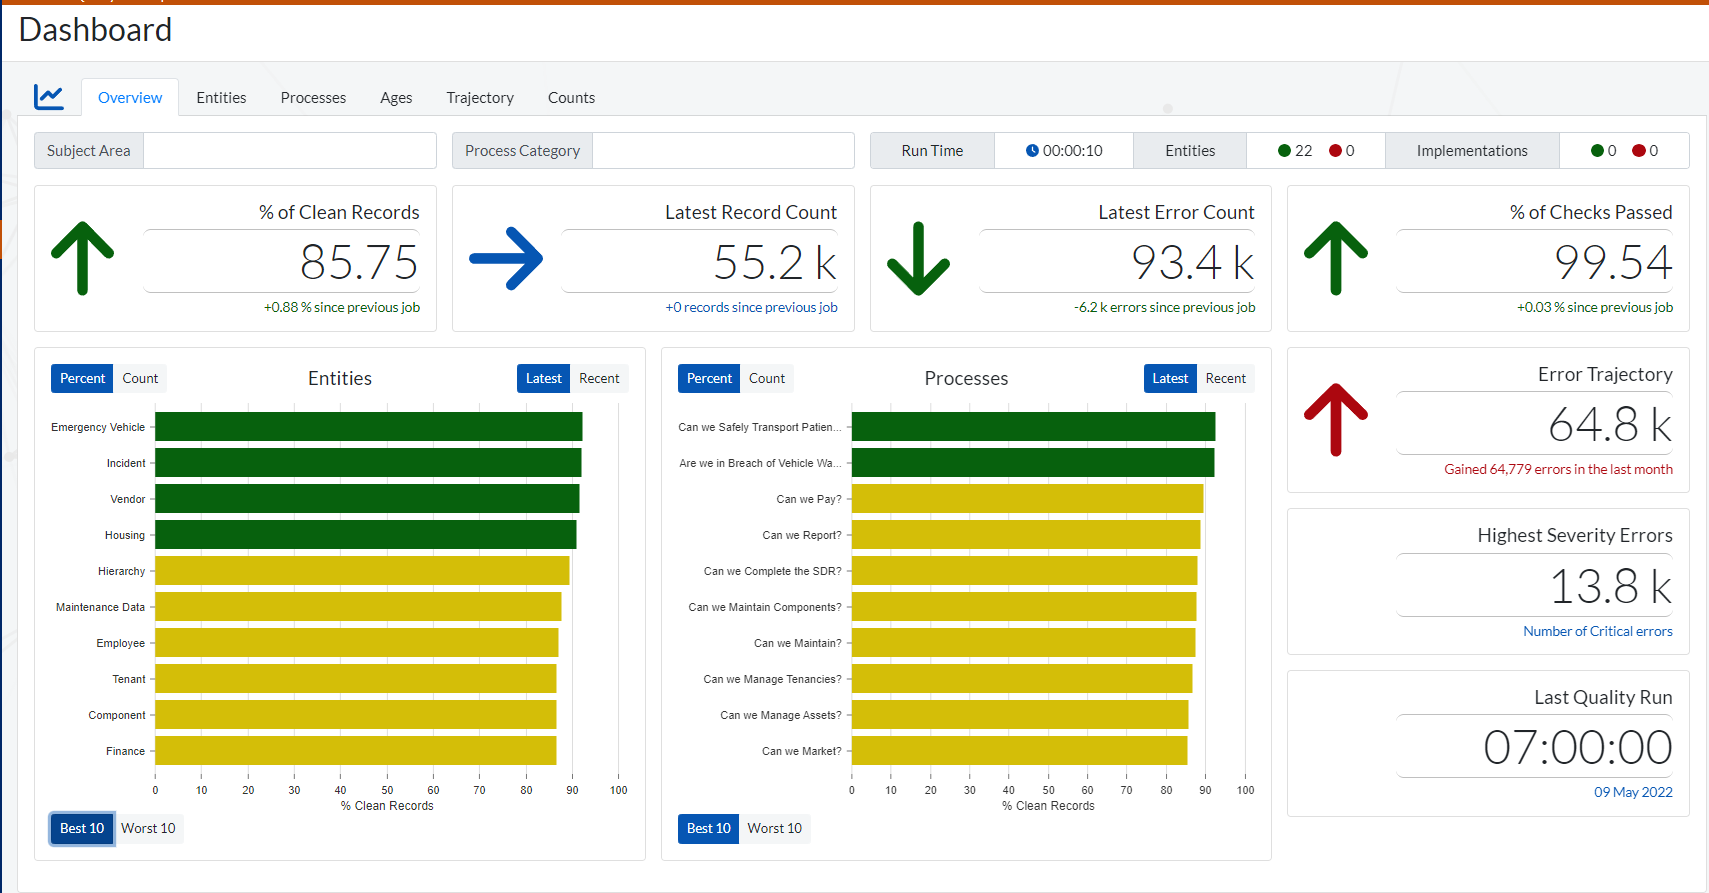

To filter the results based on ‘Subject Area’ and ‘Process Category’ simply enter them in the input boxes above.

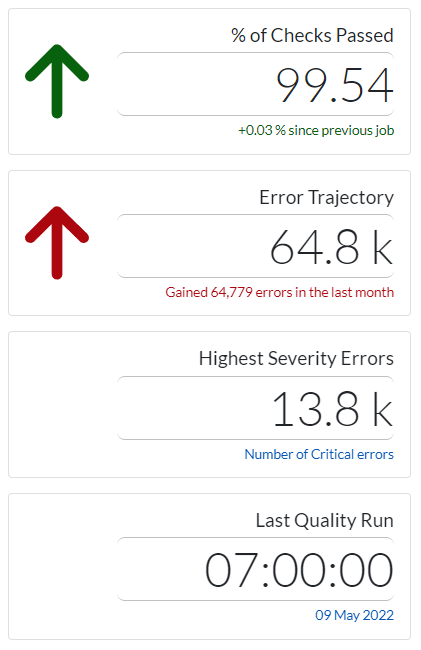
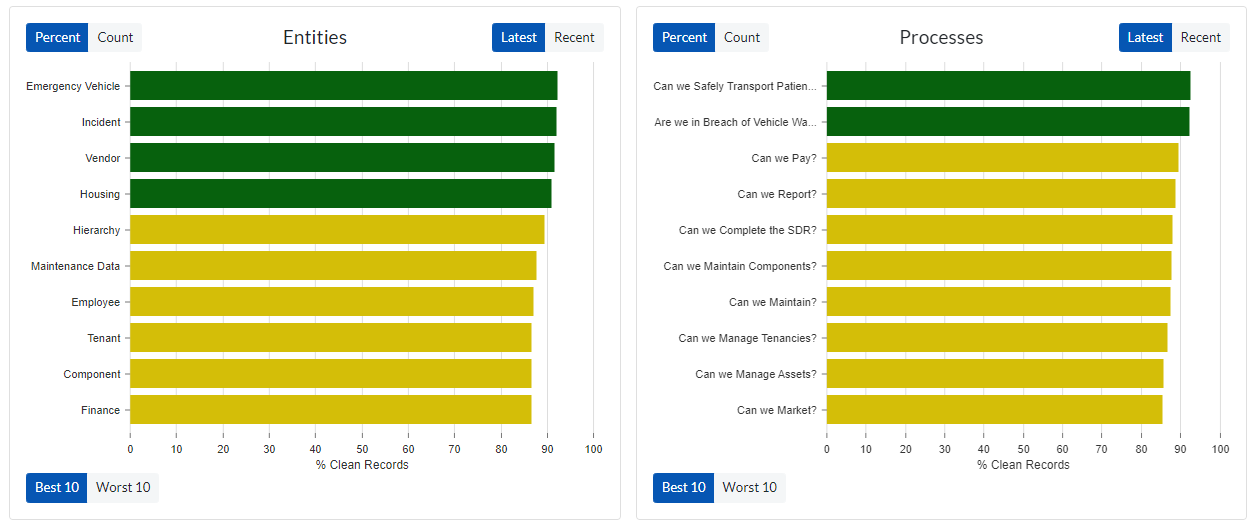
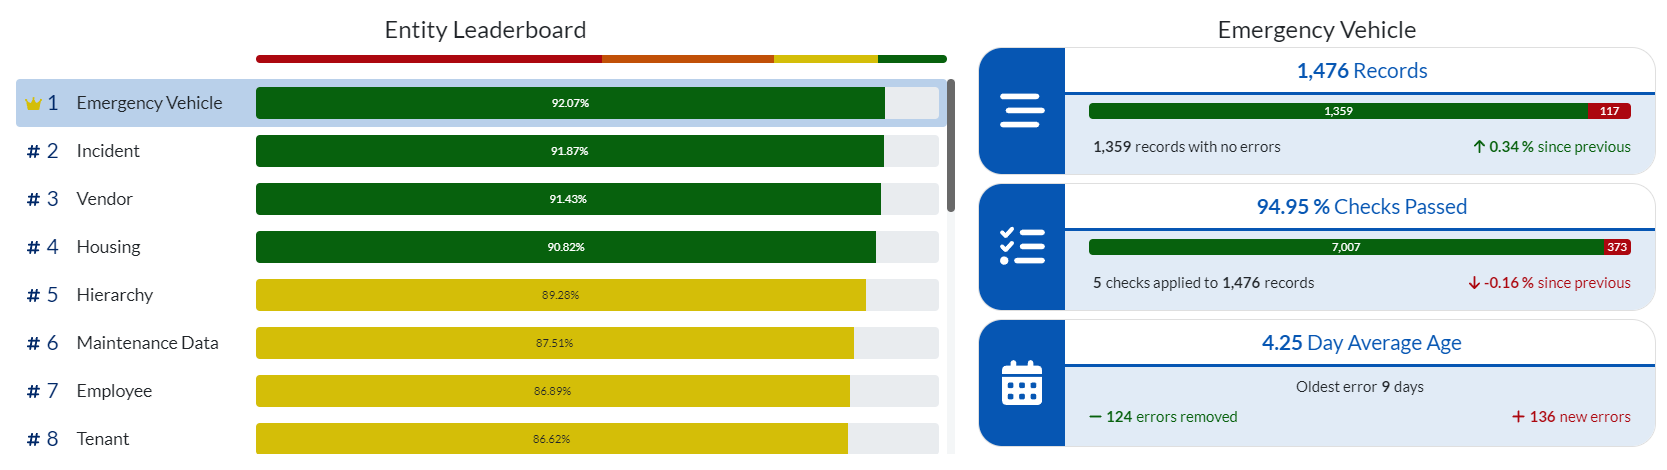
The green bars indicate that the Entity or Process is in great condition with regards to data quality. Yellow bars indicates a good to average condition .Red bars would indicate that the Entity or Process is in a poor condition and may require more attention in the cleansing process.
To toggle between Percents & Counts being displayed on the charts use the buttons (shown above) located at the top left of the charts.
To Toggle between the Latest data and Trend data being displayed on the charts use the buttons (shown above) located at the top right of the charts.
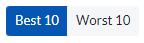
To Toggle between the Top 10 and Bottom 10 Entities or Processes with regards to data quality, use the buttons (shown above ) located at the bottom left of the charts.
Provides analysis of the data quality broken down by Entities.
Navigate to (Reports > Dashboard > Entities Tab )
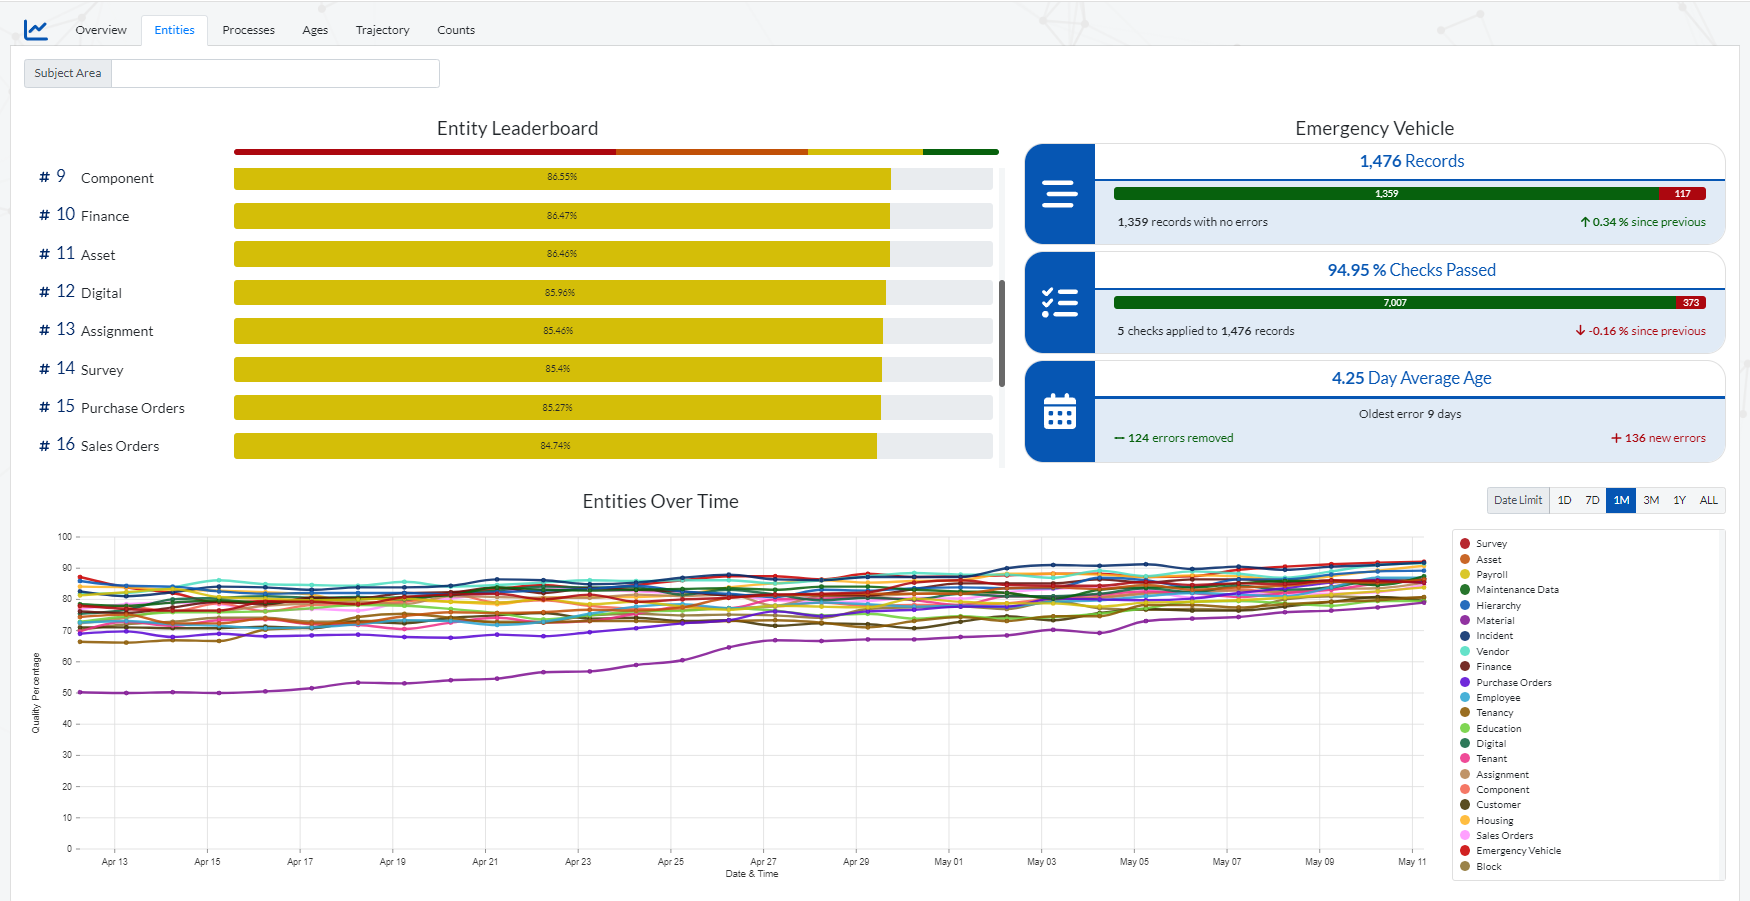
Use the ‘Subject Area' section (shown above) to filter the results displayed on the charts to a specific Subject Area.
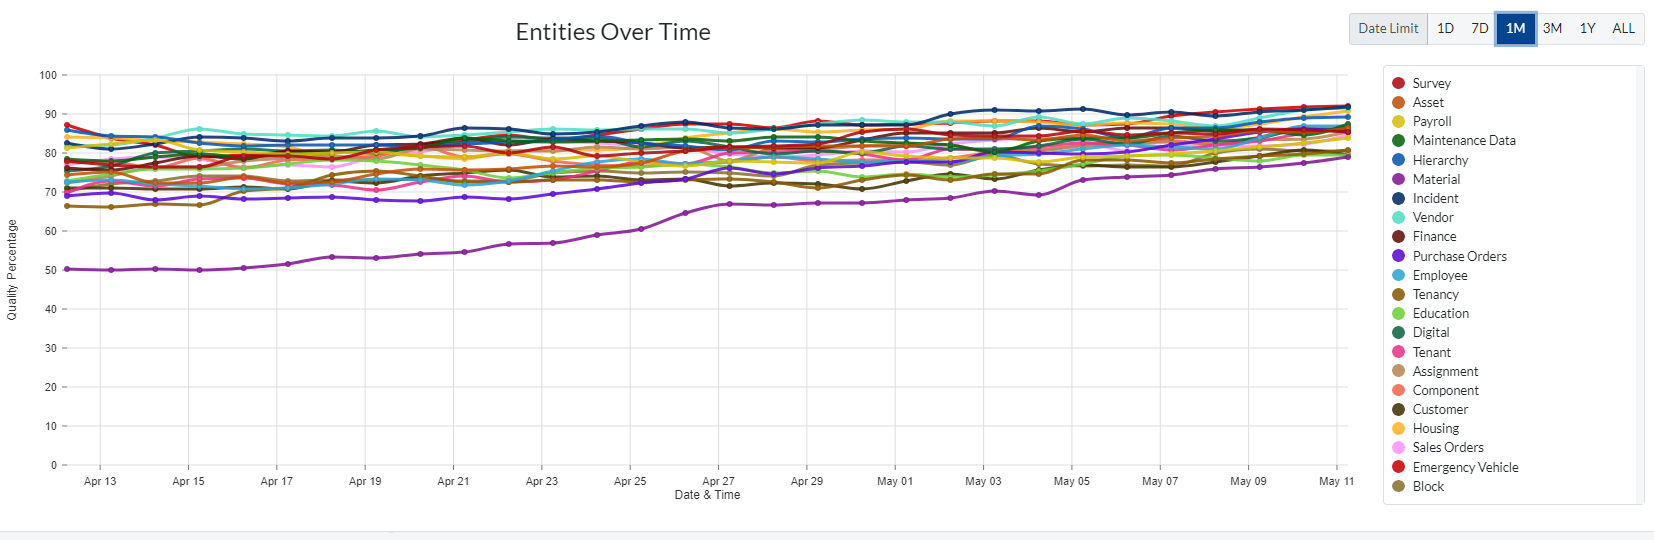
To adjust the Time period displayed on the chart. Simply click accordingly on the settings (shown above) located above the chart key.
(1D = 1 Day, 7D = 7 Days etc.)
When you hover over any data point a tooltip (shown below) will pop up. It displays the time frame at the top and a list of scores (% of all clean records) of all the Entities at that particular point in time.

Provides analysis of the data quality broken down by Processes.
Navigate to Reports > Dashboards > Processes Tab
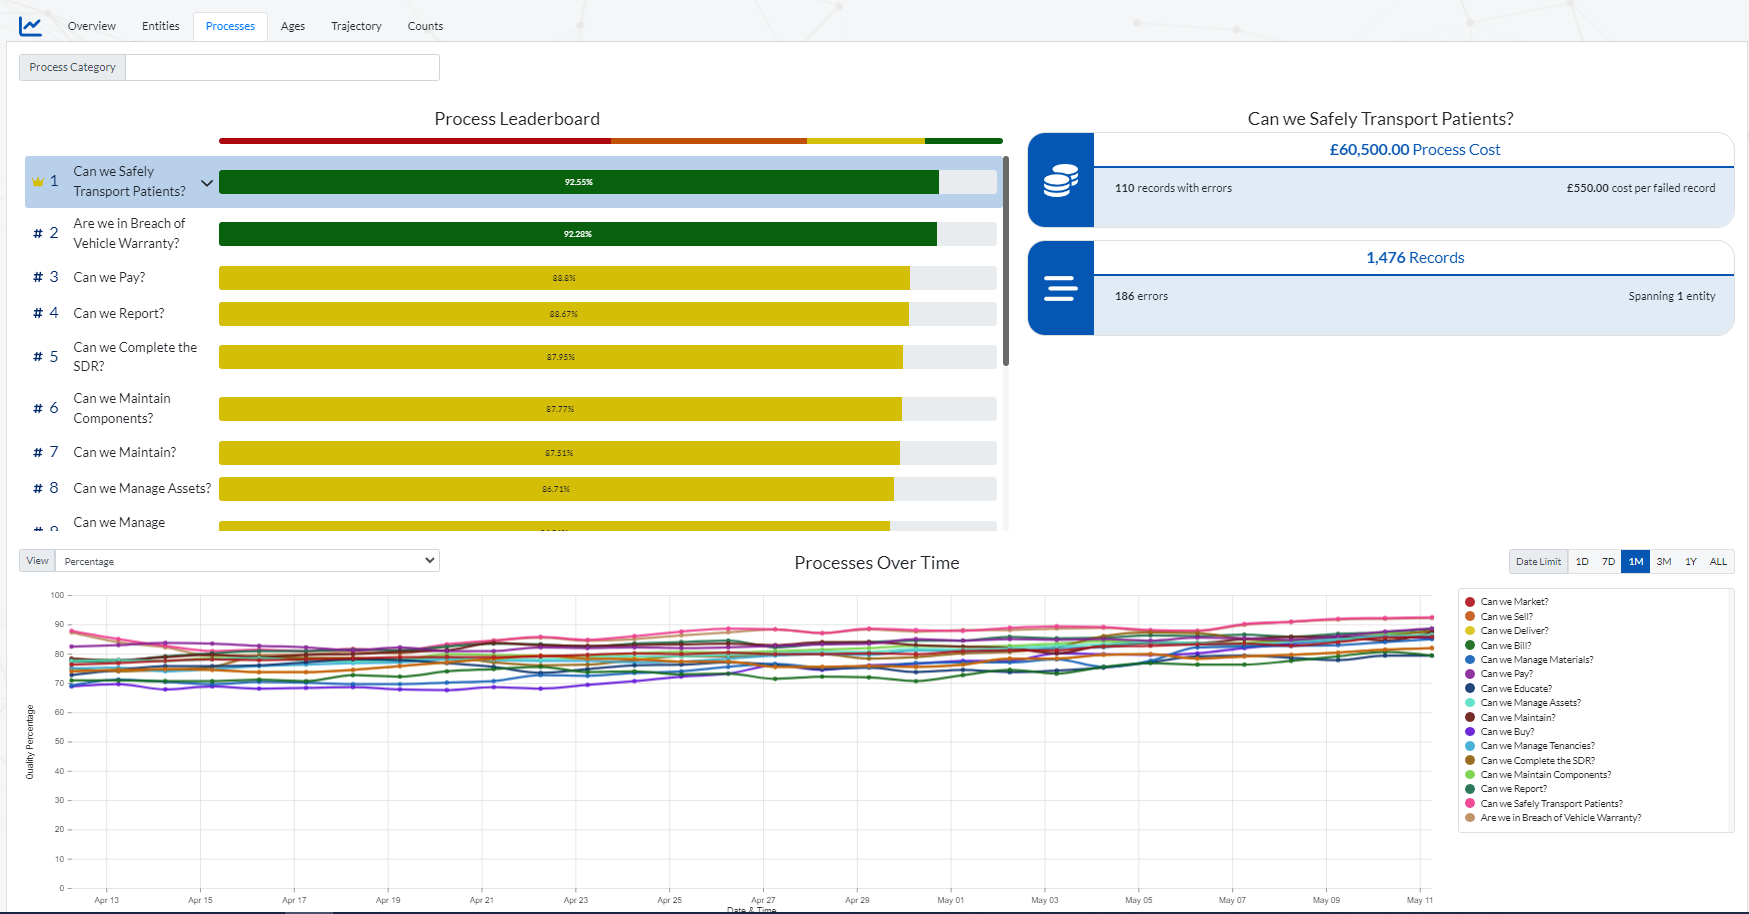
Use the ‘Process Category' section (shown above) to filter the results displayed on the charts to a specific Process category.
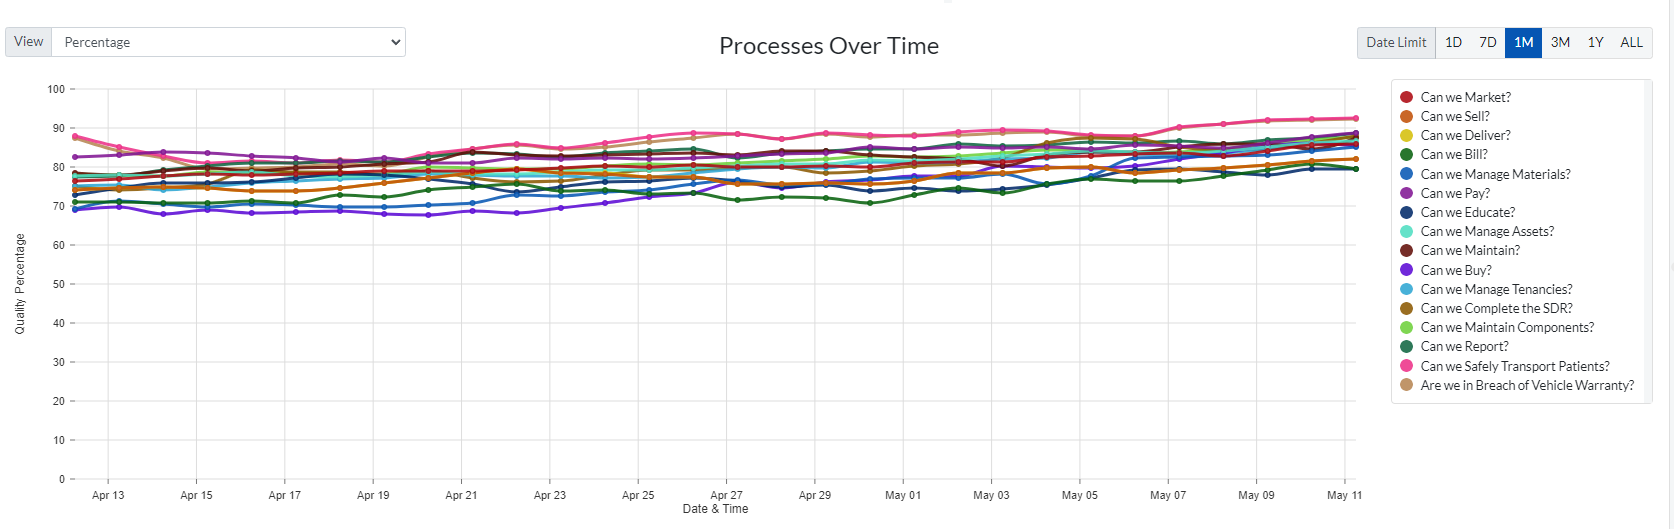
To adjust the Time period displayed on the chart. Simply click accordingly on the settings (shown above) located above the chart key.
(1D = 1 Day, 7D = 7 Days etc.)
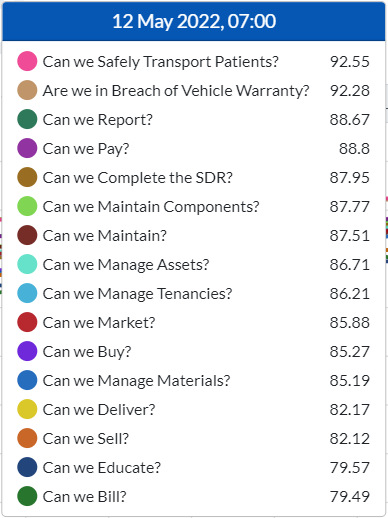
When you hover over any data point a tooltip (shown below) will pop up. It displays the time frame at the top and a list of scores (% of all clean records) of all the Processes at that particular point in time.
Provides analysis of the data quality broken down by Age (the amount of time the errors have been circulating in the system).
Navigate to (Reports > Dashboards > Ages Tab)
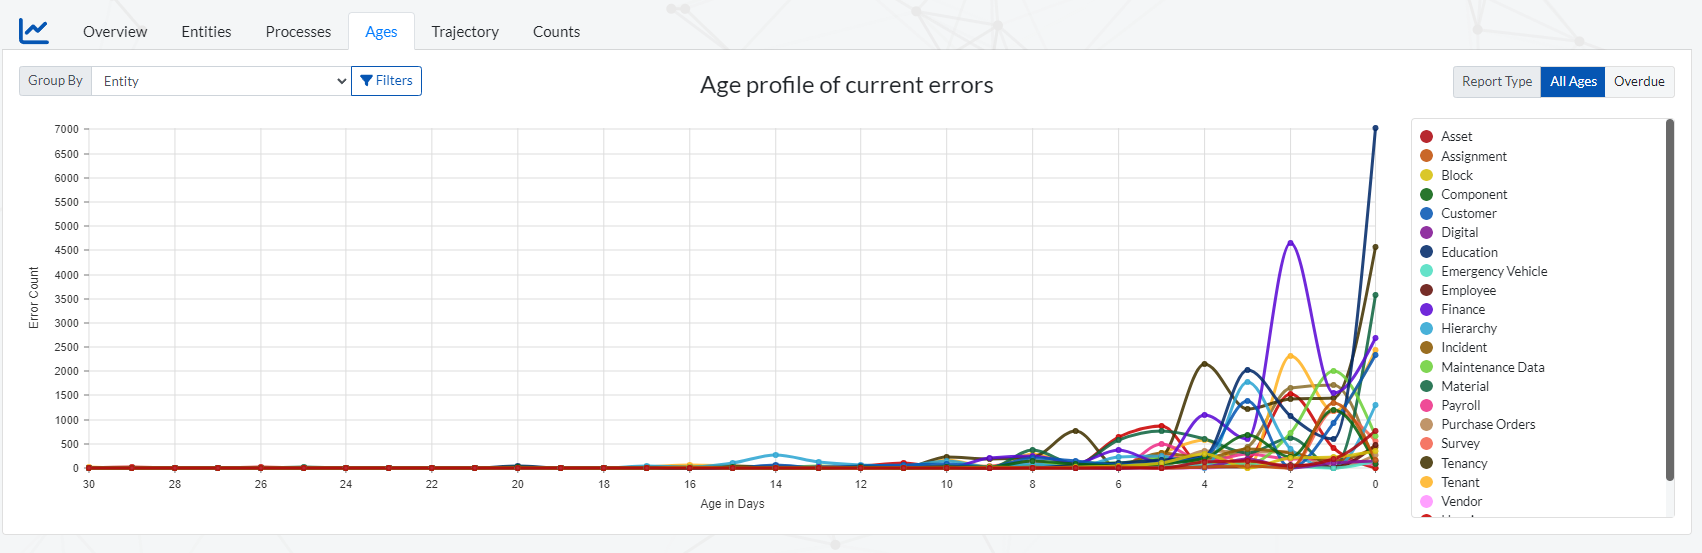
Age profile of current errors : The chart displays the errors counts and their Age in days (length of time they circulated in the Data stream before being cleansed) for each Entity. The series are split by Entities by default , but their is an option to split the series by another element using the using the drop down (shown below) on the top left of the chart.
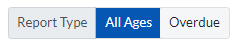
The Report Type of the chart can also be changed from displaying errors of 'All Ages’, to only displaying the ‘Overdue errors’. This is done by adjusting the setting (shown below) on the Top right of the chart. The Overdue errors are determined by the severity attached to them. Each severity type has a cleanse window set for it. Example Critical severity errors have a cleanse window of ‘1 day’ while Medium severity errors have a cleanse window of ‘14 days’.
Provides analysis of the trajectory of the data quality over certain time periods (time period is set to monthly by default) .
Navigate to Reports > Dashboards > Trajectory Tab
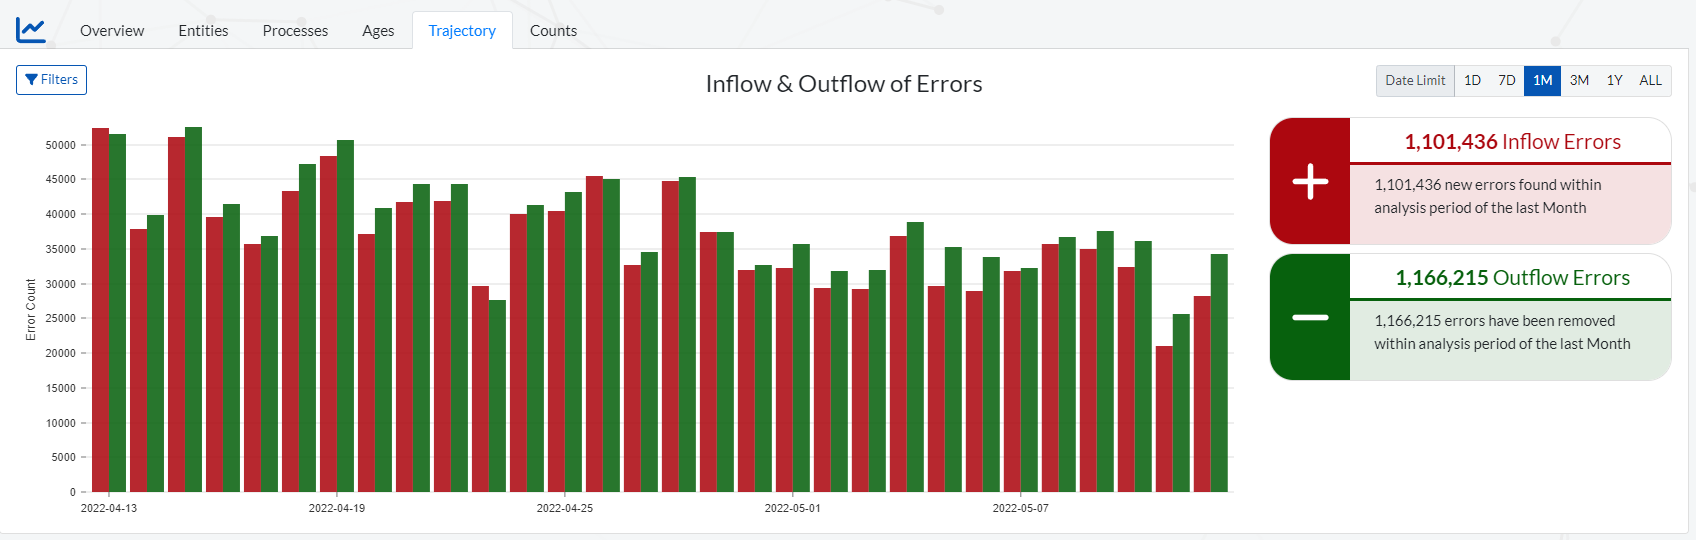
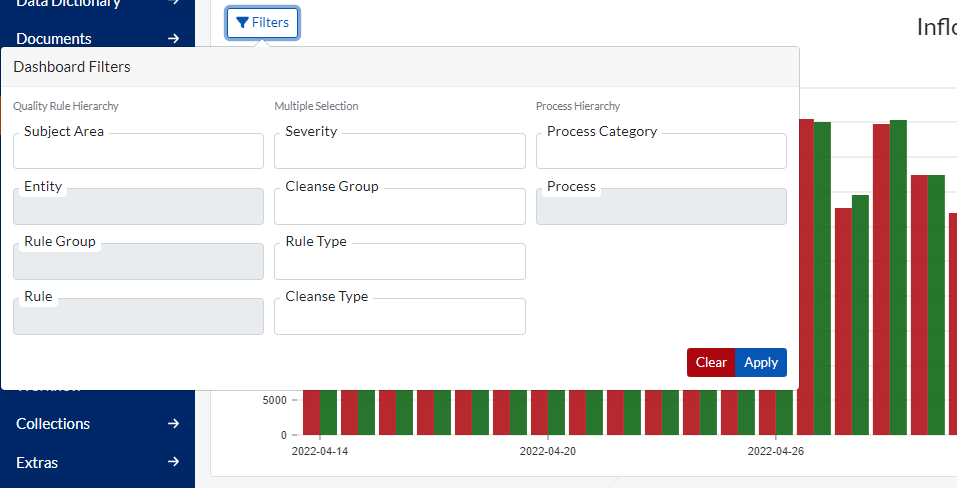
Filters can be applied on the chart by clicking on the ‘Filters’ button (shown below) located on the top left of the chart.
Provides analysis of the data quality in the form of raw error counts.
Navigate to (Reports > Dashboards > Counts Tab)
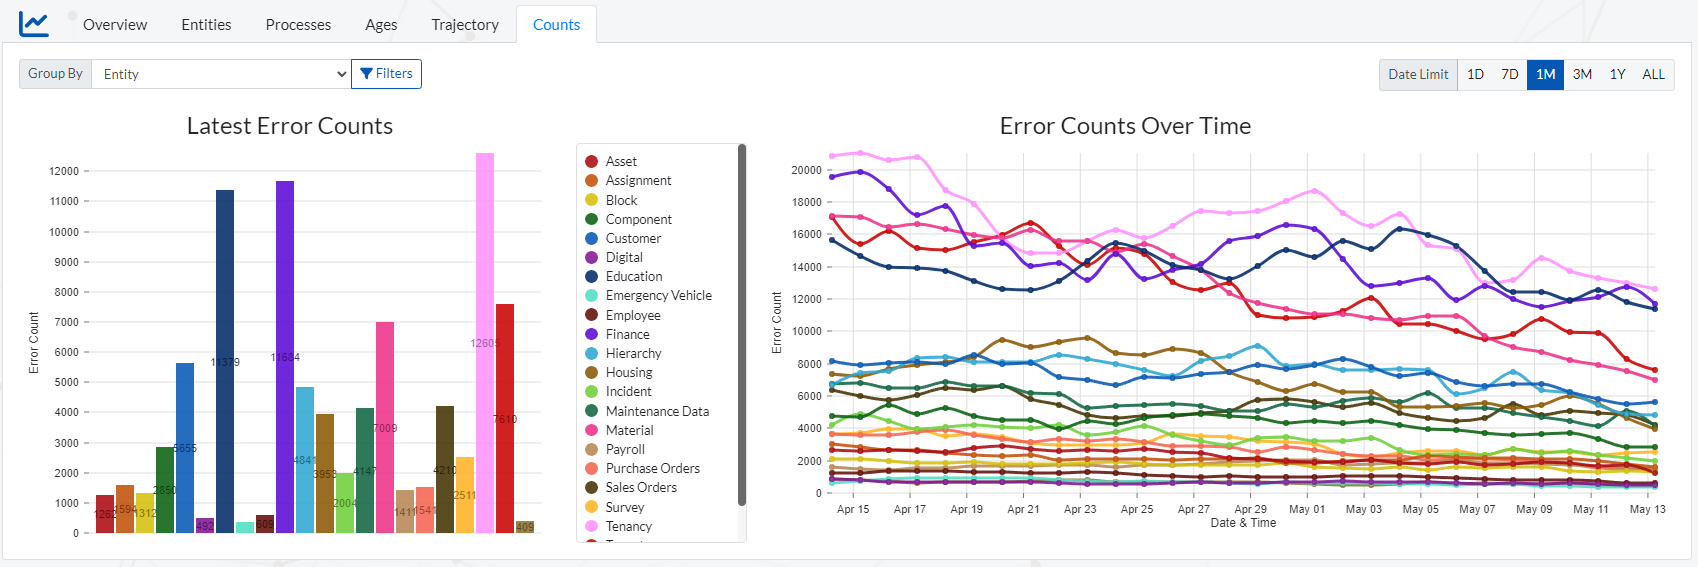
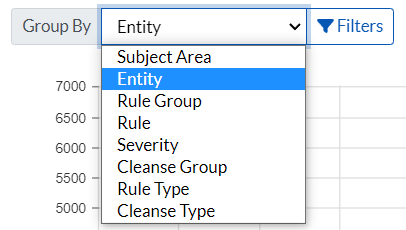
On both charts the series groupings is set to ‘Entity’ by default and this can be changed by clicking on the ‘Group by’ drop down (shown below) below the tabs.
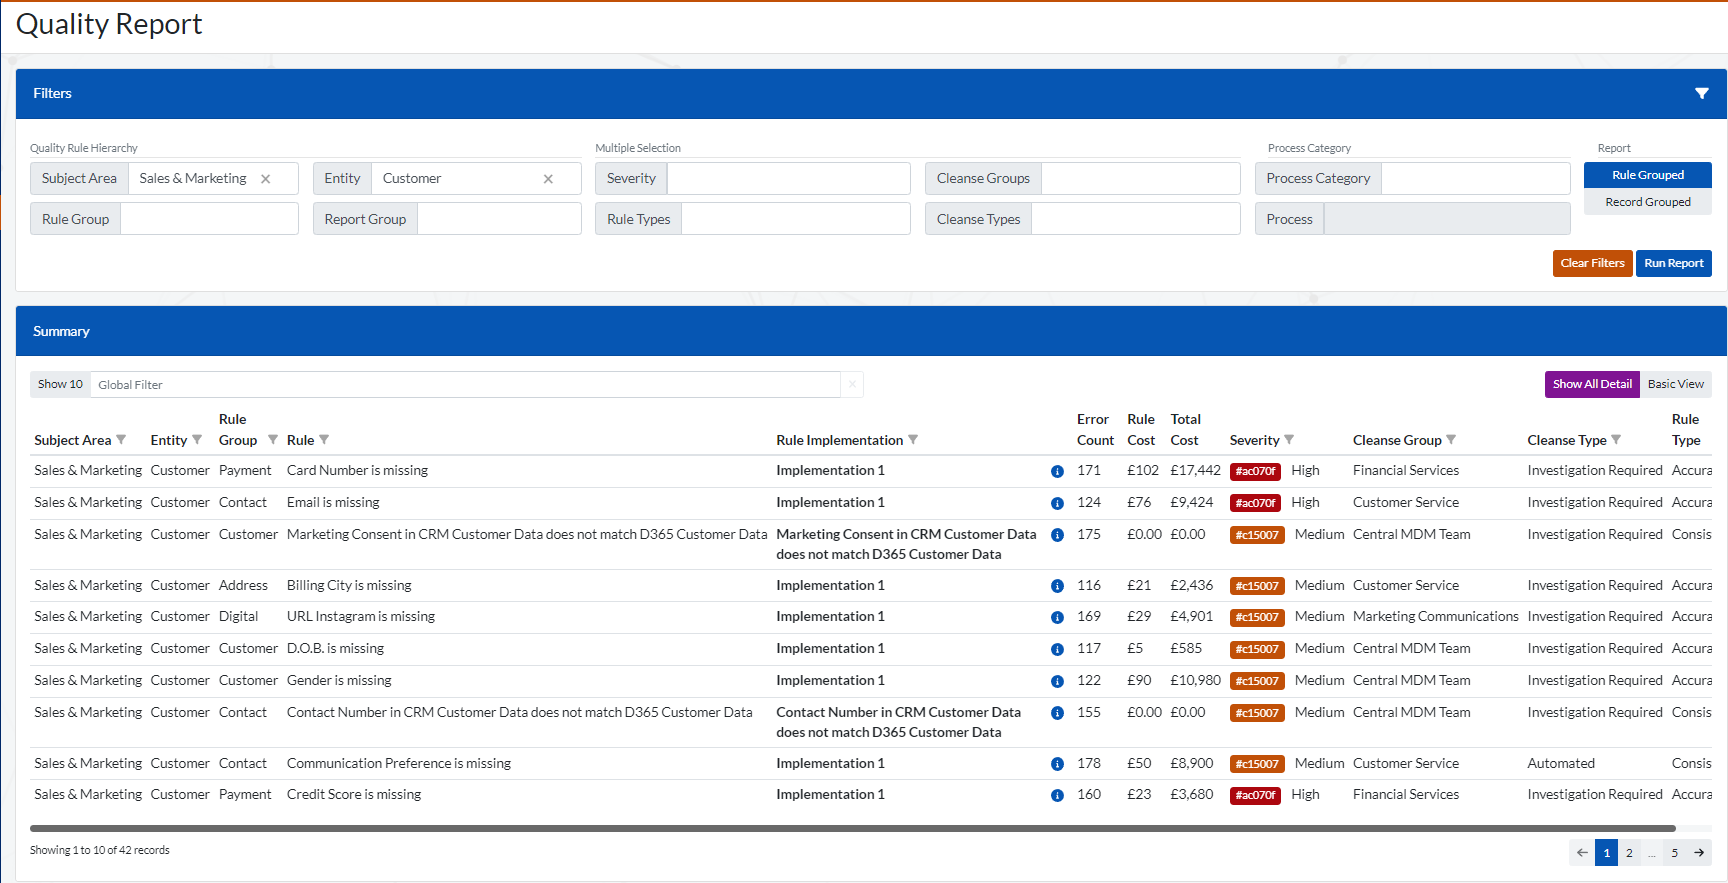
To navigate to the reports section go to (Reports > Report ).
The this section provides a summary and detailed reporting on data quality errors and affected records across the stored dataset. These reports can be used by data cleanse teams to target and resolve erroneous errors within the dataset.
The are several filters available in the ‘Filters' window (shown below) located at the top of this section. The several filters should enable users to effectively navigate to and analyze the data quality errors they are specifically interested in.
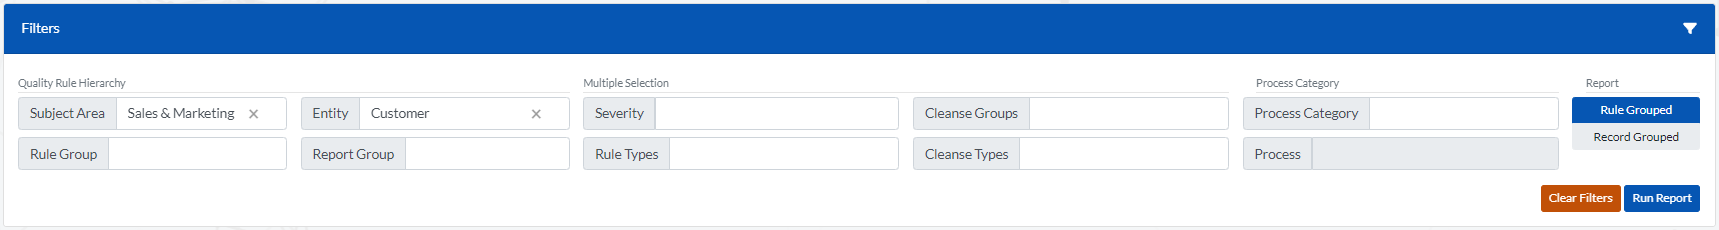
To run the report after the filters have been set accordingly click on the ‘Run Report’ button (shown below).
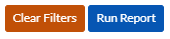
To clear all the filters and refresh the errors listed in the ‘Summary’ window, simply click on the ‘Clear Filters’ button (shown above) then click of the ‘Run Report’ button.
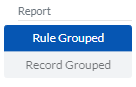
There are a set of buttons (shown below) located on the top right of the page that the user can use to toggle between the two report types ('Rule Grouped’ & ‘Record Grouped’) . After selecting a report type, you have to click on the ‘Run Report’ button for the change to take effect.
By default the Report type selected is ‘Rule Grouped’. This displays a list of Rule Implementations in the ‘Summary’ window (shown below) that picked up errors.
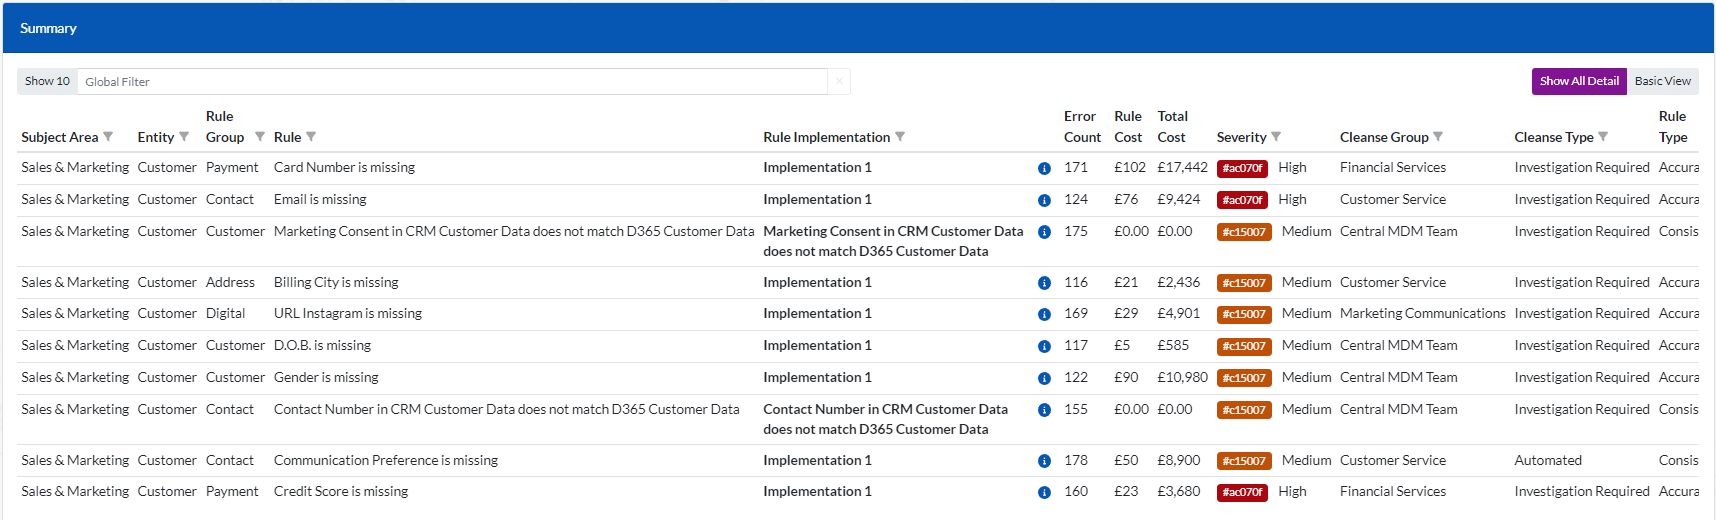
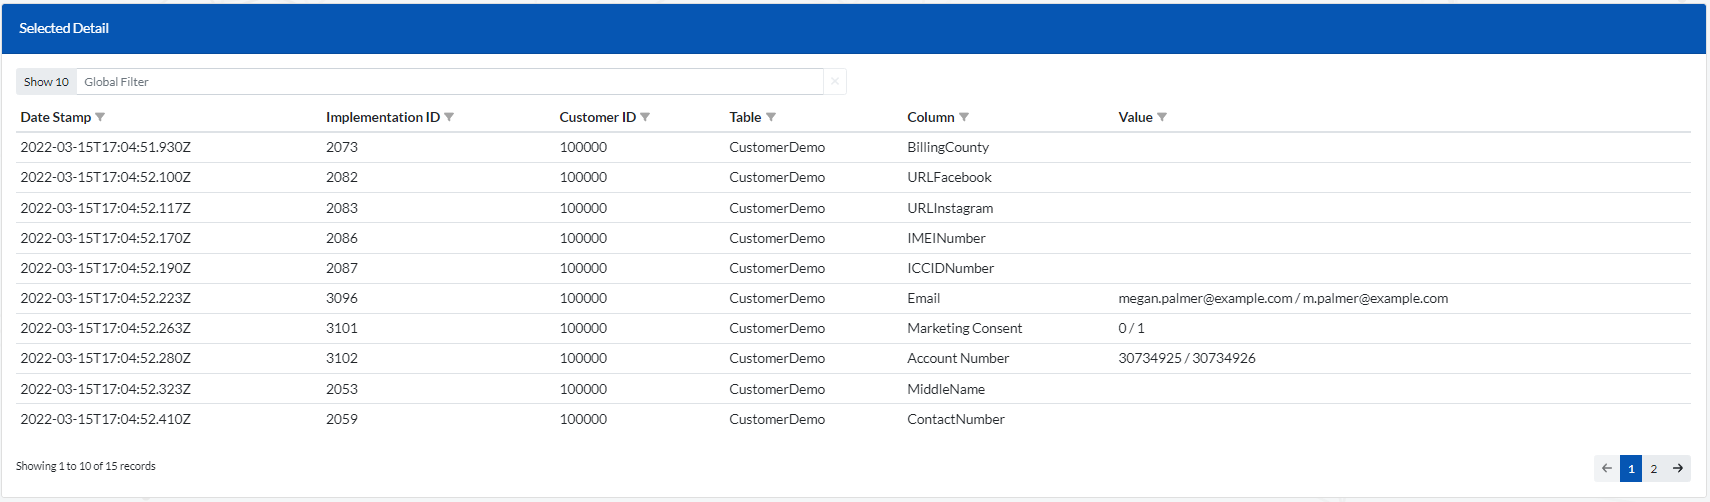
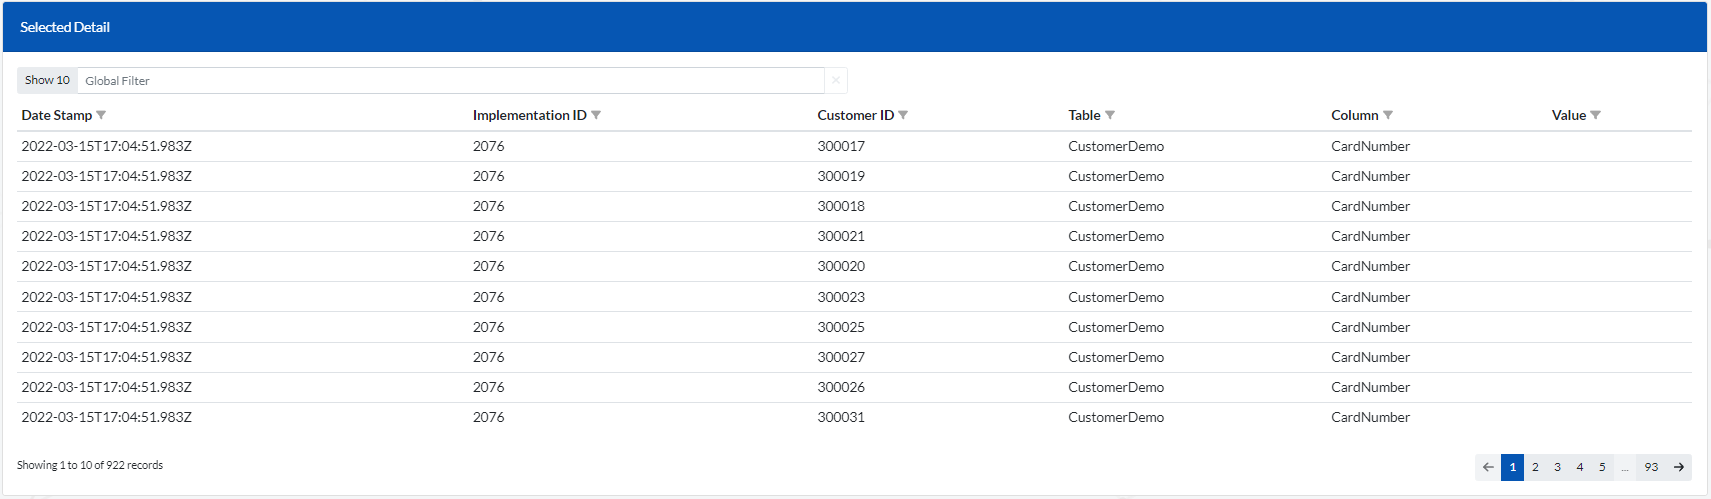
Essentially the errors are grouped by the Rule implementations. Therefore when you click on a particular Rule Implementation on the ‘Summary’ window (shown above) A ‘Selected Detail’ window (shown below) will appear below the ‘Summary’ window displaying all the errors linked to the selected Rule implementation.
This displays a list of records in the ‘Summary’ window (shown below) where errors have been found. The errors are essentially grouped by Records in this case the errors are grouped by (ID). This report type is ideal for determining entities (eg. Property, Customer, Tenancy ) within the data that are problematic with regards to data quality issues.
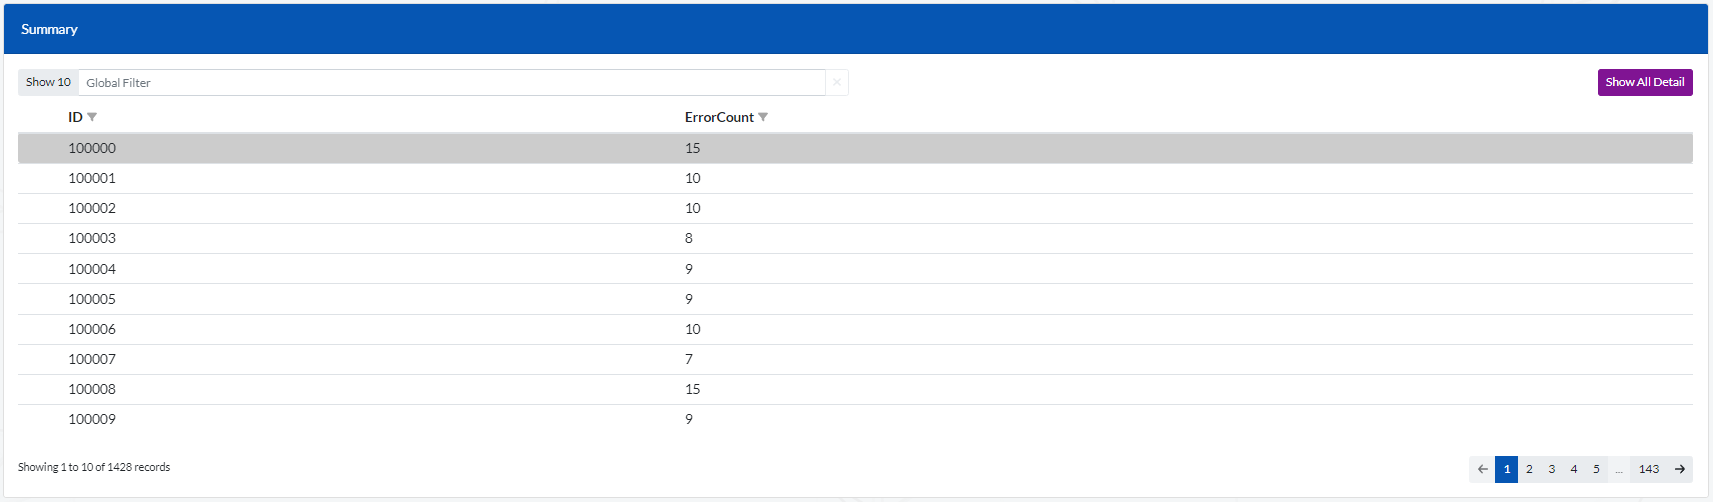
Therefore when you click on a particular Record on the ‘Summary’ window (shown above) A ‘Selected Detail’ window (shown below) will appear below the ‘Summary’ window displaying all the errors linked to the selected Record.