One of the best features of Data Studio is the ability to easily explore large datasets containing millions of records and hundreds of columns of data.
There are a number of ways to explore your data in a grid:
Once in Explore mode it is possible to apply actions to the data. These actions are mostly the same as their Workflow step counterparts.
Filter your data by selecting a column and entering a comparison value to match against using an operation like Equals, Contains or In Range. To filter on multiple columns and/or multiple comparison values create an advanced Function that returns a boolean (true or false) value.
In Explore mode, right-click on a value in a column and select one of the options Keep or Remove to show or exclude all rows containing the chosen value.
The Split Workflow step is the same as Filter but has the benefit of two outputs to see the rows that pass the filter and the rows that fail the filter.
Limit the number of rows or take a random sample or rows.
Examples for consecutive rows:
Examples for non-consecutive rows:
In Explore mode, the Columns action is used to update the order in which columns appear and to exclude/hide (or show) columns from the output. Note this is done using the Transform step within a Workflow.
Right-click on a column header and select Exclude.
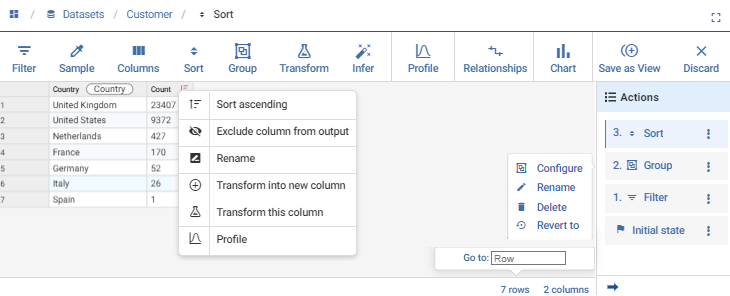
Sort your data in ascending/descending order.
Move columns from 'unsorted columns' to 'sorted columns', set the sort order (min to max or max to min) for each column using Flip sort direction or the up/down arrow on the right of each 'sorted column'.
Select a 'sorted column' and use the 'move up'/'move down' buttons to change the priority order if sorting on mutliple columns.
Grouping will reduce the number of rows in a table.
The default output of a Group step is the Count aggregate, which returns the total count of rows. This count will then be broken down by each unique value in the group column.
Moving columns from ungrouped to grouped will show the distinct/deduplicated values in the column (along with the optional Count of the number of times each combination of values appears in the data).
The Add aggregate button is used to create a new column(s) containing a value or metric for each group.
Give the new aggregate column a name or optional suffix value if applying an aggregate on Multiple columns, then select the type of aggregate to use.
| Aggregate | Description |
|---|---|
| Count | Returns a count of the number of items in each group. |
| Count excluding nulls | Returns a count of the number of items in each group ignoring null values. |
| First value | Returns the first value in the column for each group. |
| First populated value | Returns the first value in the column for each group that is not null. |
| Last value | Returns the last value (based on input row order) in the column for each group. |
| Minimum value | Returns the minimum value in the column for each group. |
| Maximum value | Returns the maximum value in the column for each group. |
| Grouped values | Returns a comma separated list of all values in each group. The order is as they appear in the input. |
| Sorted grouped values | Returns a comma separated list of all values in each group sorted A to Z. |
| Reverse grouped values | Returns a comma separated list of all values in each group sorted Z to A. |
| Average | Returns the average (mean) of the values in each group. |
| Median | Returns the median (based on a sort of the values) of the values in each group. |
| Sum | Returns the sum of the values in each group. |
| Standard deviation | Returns the standard deviation of the values in each group. |
| Standard deviation (population) | Returns the standard deviation of the values in each group where it is known that the values represent the whole population. |
| Variance | Returns the statistical variance of the values in each group. |
| Variance (population) | Returns the statistical variance of the values in each group where it is known that the values represent the whole population. |
| Group ID | Returns a numeric value that can be used to identify each group. |
Non-numeric values will be excluded (ignored) from numeric aggregation calculations. Zero will be returned by default if the values are all non-numeric.
In Explore mode you can drill into a particular group to see the rows that belong to it by right-clicking and selecting View rows in group.
This ability to drill down into grouped values will be retained if the step is connected to any of the following subsequent steps: Branch, Chart, Export, Filter, Fire event, Output, Sample, Sort, Split, Take Snapshot, Transform and Union.
Manipulate and configure your data.
This step allows you to add/remove various Functions and arrange or exclude columns.
Clicking the Columns row on any Transform Workflow step will open the panel where you can select the columns you want to work with.
Moving columns allows you to change the order in which they appear in the data. This can be done by selecting the columns and pressing the up/down arrow button next to the columns list.
Columns can also be moved by dragging them up/down the list.
Rename a column by selecting the column and clicking Rename on the toolbar. You will then be presented with a modal box prompting you to enter the name and an optional summary.
If multiple columns are renamed at the same time, the modal box will provide you with an opportunity to apply a common prefix or suffix to the originating column name. Alternatively, you will be able to rename all columns individually.
Select the columns you want to exclude and click Exclude in the toolbar. This can also be done by hovering over the column name and clicking the inline icon.
To make columns visible again, select the columns and click the Include button in the toolbar.
A column can be transformed by applying one or many Functions to it. These Functions range from a simple action, such as converting a column to uppercase, to more complex multiple column operations.
Whatever it may be, transforming a column can be done to create a new column or to change the data in an existing one.
Before applying any custom transformations, you can use the Suggest option to analyze the data being explored and return some recommended transformations based on its content.
Any of these suggestions can be applied to the data by checking their selection boxes and clicking Apply.
The transformation suggestions can also be created as new columns rather than replacing the original data, by checking New column? in the table and specifying a column name.
If the column already has a transformation Function applied you will first be prompted to choose whether to 'Append to existing functions' or 'Replace existing functions'.
Duplicating columns can be done by selecting the columns and clicking Duplicate on the toolbar. The duplicated column will be placed after the original column and will be renamed with the prefix 'Copy of '.
To remove the Functions applied to columns, select them and click Delete on the toolbar.
You can only completely delete a created column rather than just remove the transformation, because created columns can't exist without a Function.
Profiling helps you quickly understand your data, showing the uniqueness, completeness, frequency, outliers and more. Find out more about profiling data.
In data where values are repeated, i.e. the same customerId could appear many times in sales order data, this tool can be used to both check that related columns always return the same value and highlight where there are conflicts.
Learn more about identifying data conflicts.
Visualize you data. Learn more about Charts.
Any actions applied to the data are listed in the order they were applied in Actions list on the right-side. Clicking on an action will show the data as it appeared before additional actions were applied. Right-click (or menu) on an action shows options to Configure, Rename, Delete or Revert to (delete all actions applied after the selected action).
It is possible to minimize this panel to show more of the grid using the right arrow at the bottom of the panel.
The ability to easily drill down into the underlying rows behind your results in known as interactivity or interactive drilldown. Data that has been grouped, profiled, validated or analyzed for conflicts will show additional actions buttons like Values, Formats, Show passing rows, View rows in group.
For example, exploring data grouped with a count by 'Country', a user can right-cick on 'France' to see which specific rows contributed to that count. Similarly show the rows that have failed the user-defined rule 'Must be a valid date'.
Right-clicking on grid cells or column headers shows options to quickly apply an action such as a filter, sort or an interactive drilldown.
A count of both the columns and rows is shown in the bottom right corner of the grid. Clicking on these values allows you to search for and quickly jump to a particular column or row.
A user with the correct permissions can save the actions they have applied using the button Save as View (or Save as Chart). The original Dataset remains unaltered. Learn more about Views.
When editing a Workflow, clicking Show step results on any step opens the grid in Explore mode allowing you to check the results are as expected. Applying any actions like Filter, Group, Transform, etc. will enable the Add to Workflow button that will return you to the Workflow with the actions converted into corresponding Workflow steps.