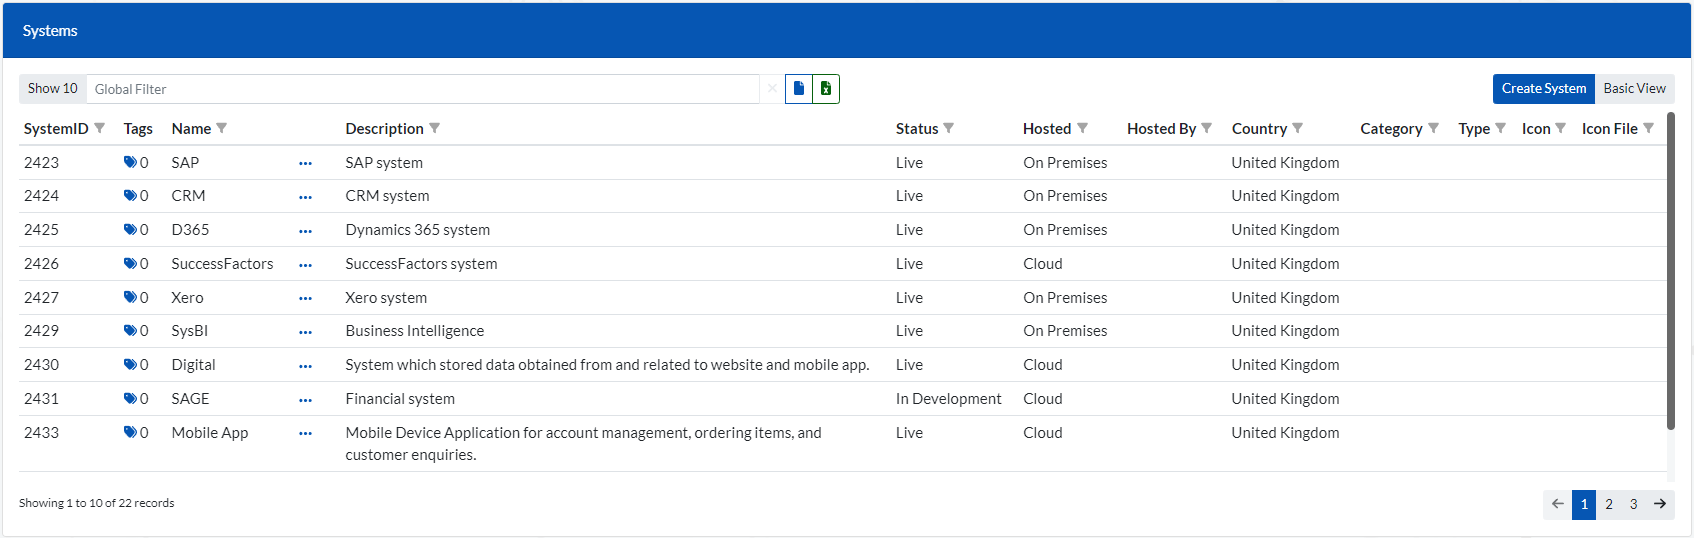
These are the systems that make up your architecture. They can be anything from systems, to spreadsheets, to user groups or 3rd parties. Defined systems can then be used within ‘Data Lineage’ and ‘Profiling’ sections.
From the main menu go to (MetaData > Systems). You will be presented with the list of current systems as shown below.
The Systems as well as the Tables and Columns windows have the same functionalities located on top of the items list (refer to image below).
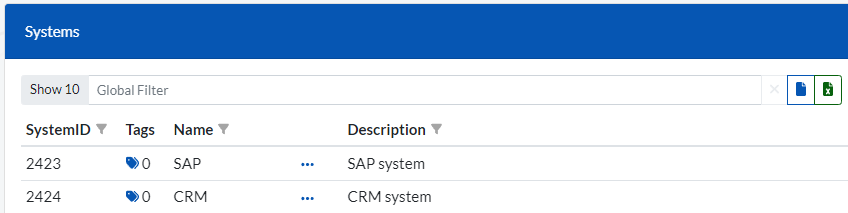
They include:
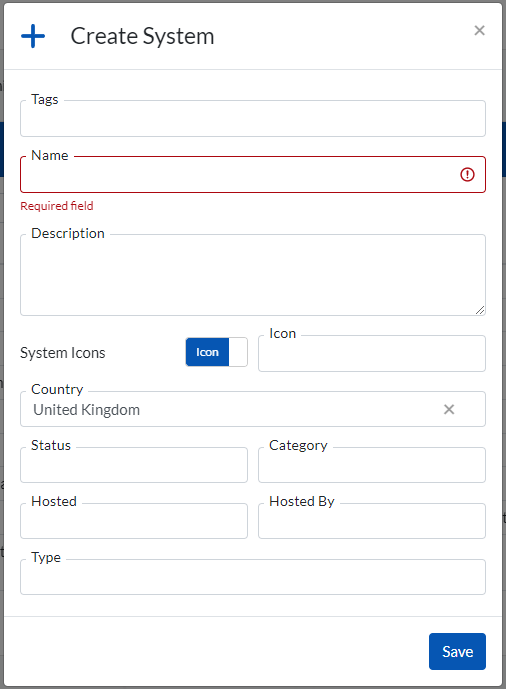
Clicking on the ‘Create System’ button in the Systems Window will prompt the window below.
Here you can view and manage your table metadata which can then be used in Governance and Profiling sections.
Tables and columns can automatically be created by importing the metadata in the systems section.
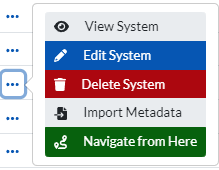
In the Systems window (MetaData > Systems), identify the system to which the tables and columns belong to and click on the icon (below) next to the System description.
![]()
When prompted with the window (below), click on ‘Import Metadata’
Tables can also be manually and individually created:
From the main menu go to (Metadata > Tables) and you will be presented with a list of all current tables.
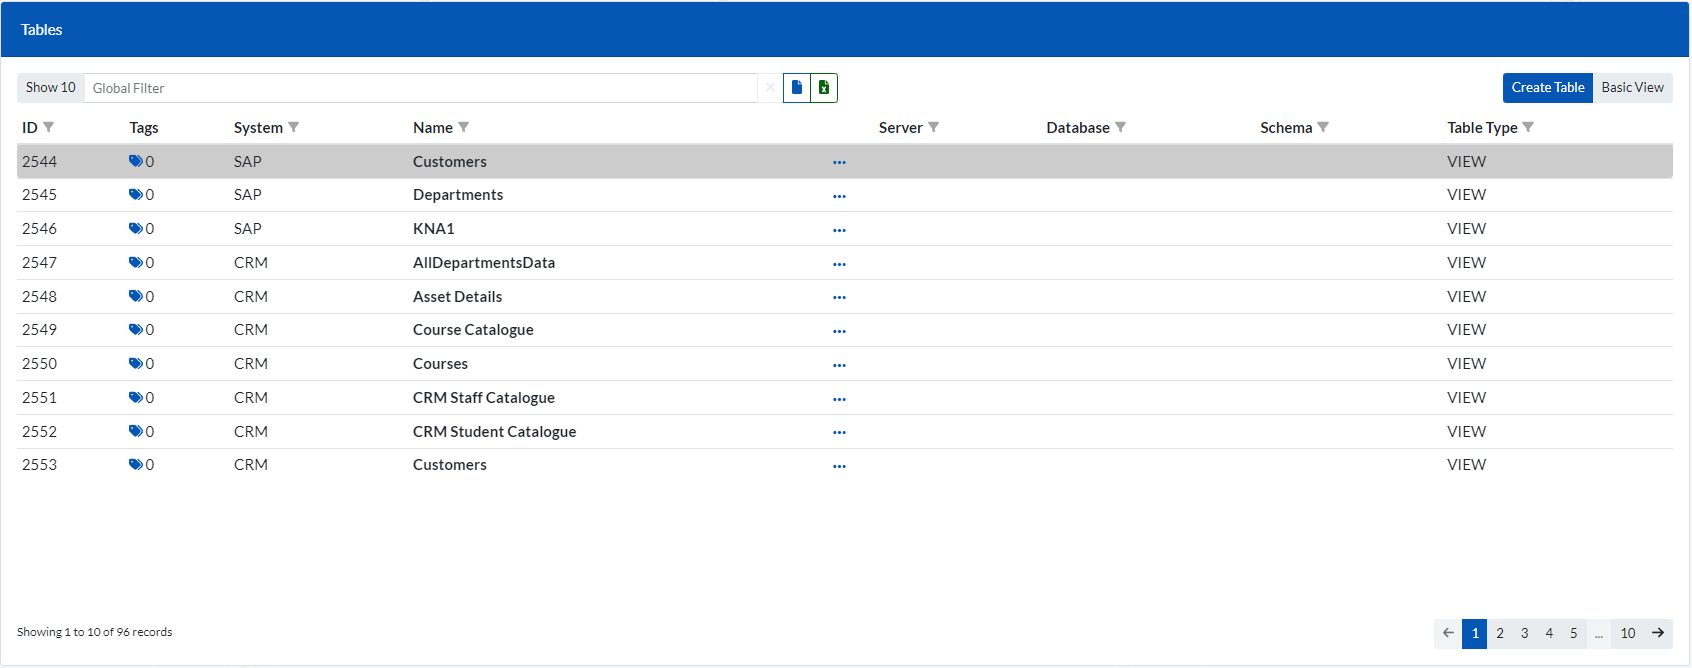
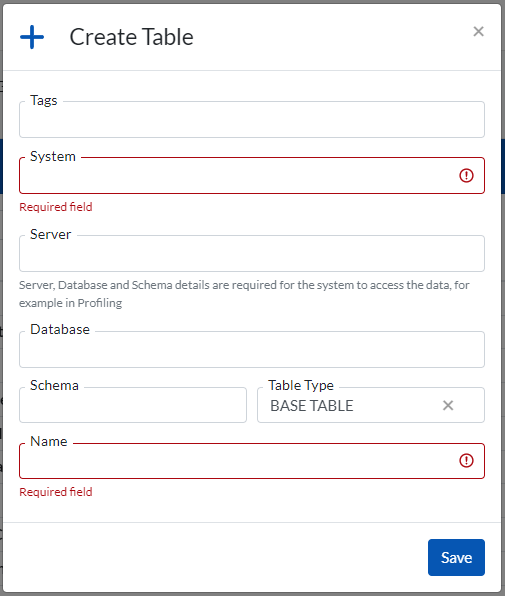
Clicking on the ‘Create Table’ button will prompt the window below.
Similar to the Tables section, here you can view and manage your column metadata which can then be used in Governance and Profiling sections.
Columns can automatically be created by importing the metadata in the systems section.
Columns can also be manually and individually created. From the main menu go to (Metadata > Columns) and you will be presented with a list of all current columns.
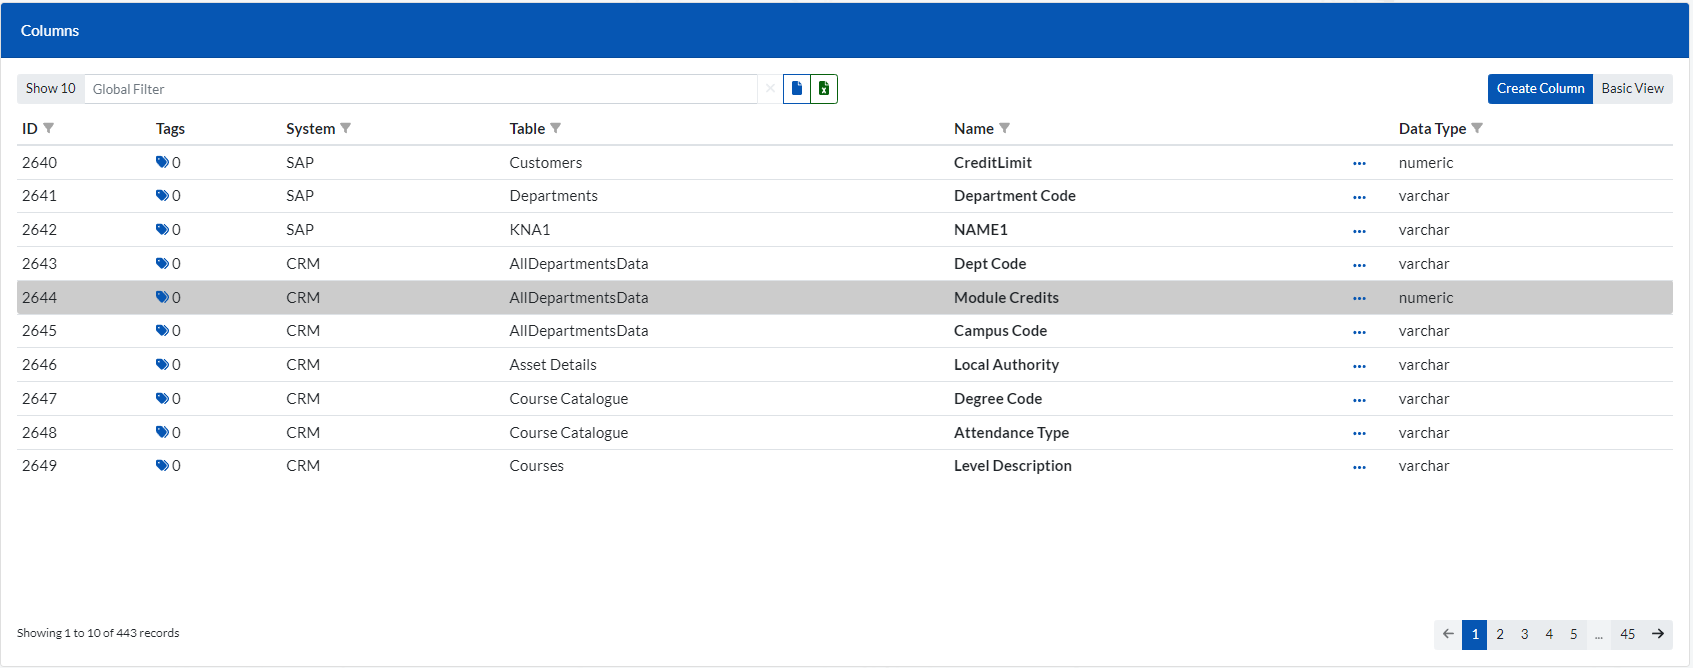
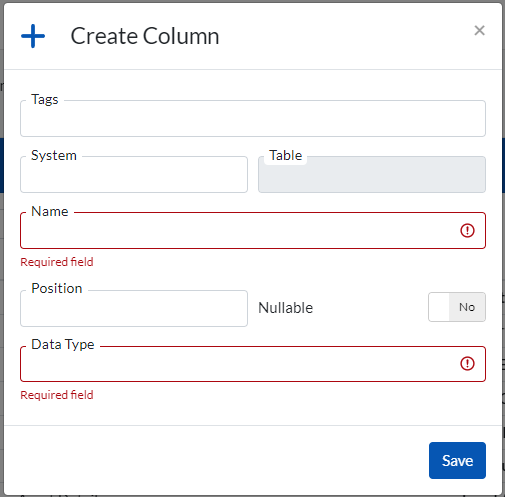
Clicking on the ‘Create Column’ button will prompt the window below.
The Profiling Control Panel is where the Profiling jobs are created and executed. A detailed history of the profile jobs run so far can also be viewed in this section.
Go to (Profiling > Control Panel).
The control panel consists of the several windows below:
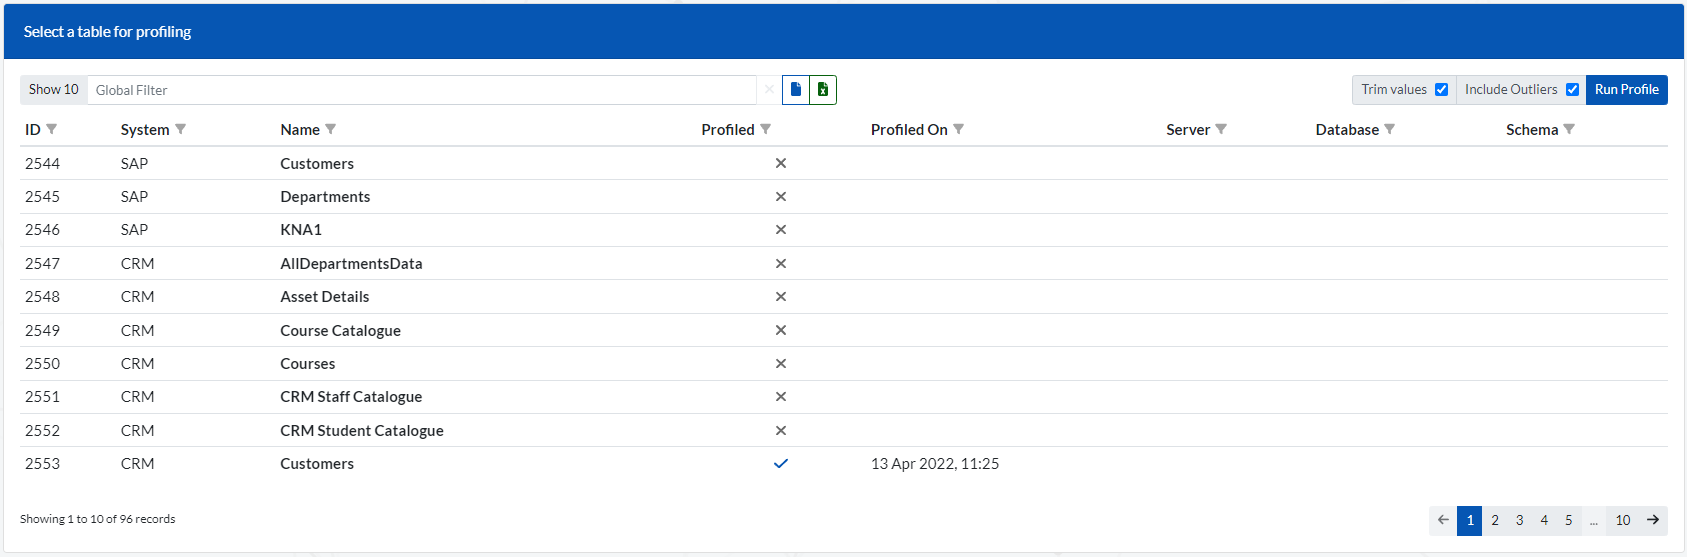
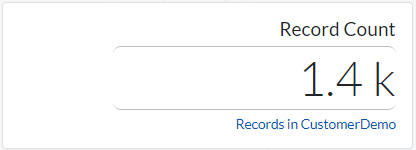
Contains List of all tables available to be profiled. If a table has already been profiled a tick will be displayed in the ‘Profiled’ column. These tables will be available for analysis in the ‘Profiling > Dashboard’ section.
To run a profile on a table, simply select the table and click the ‘Run Profile’ button.
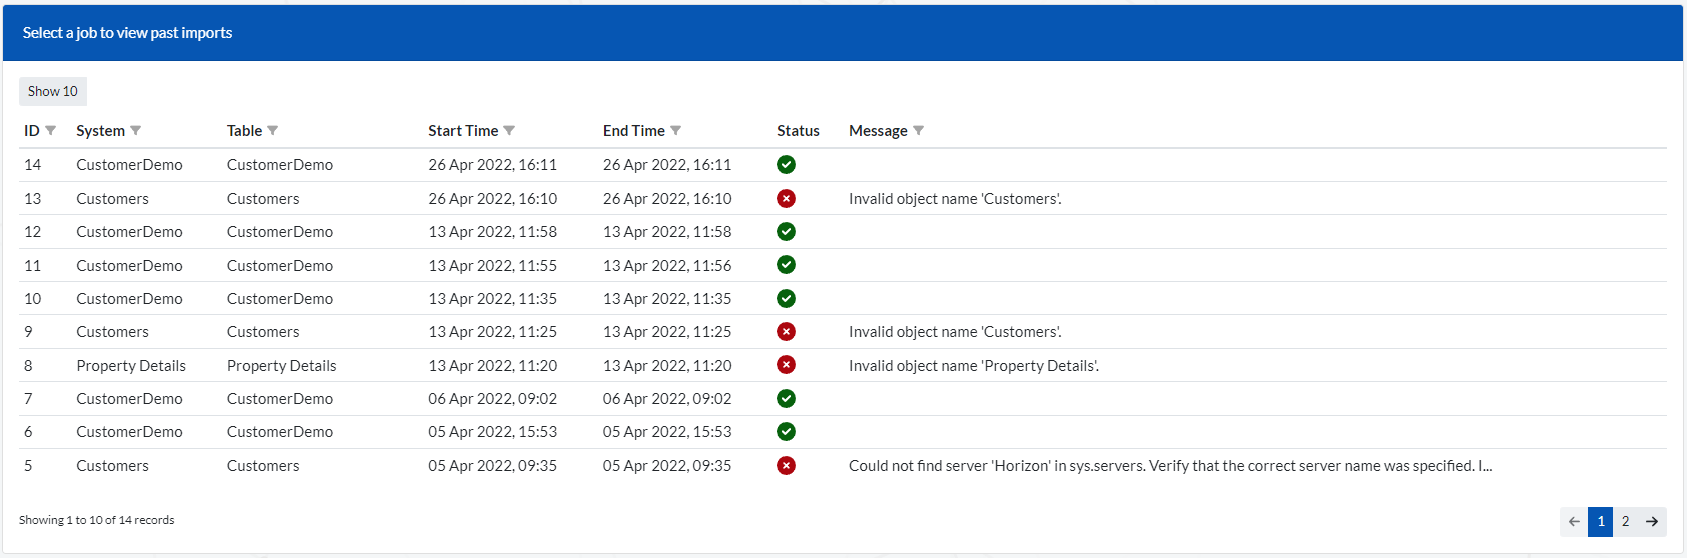
This window contains a list of all profiling jobs run so far and their status (passed or failed). Click on a job to view more specific details on that job.
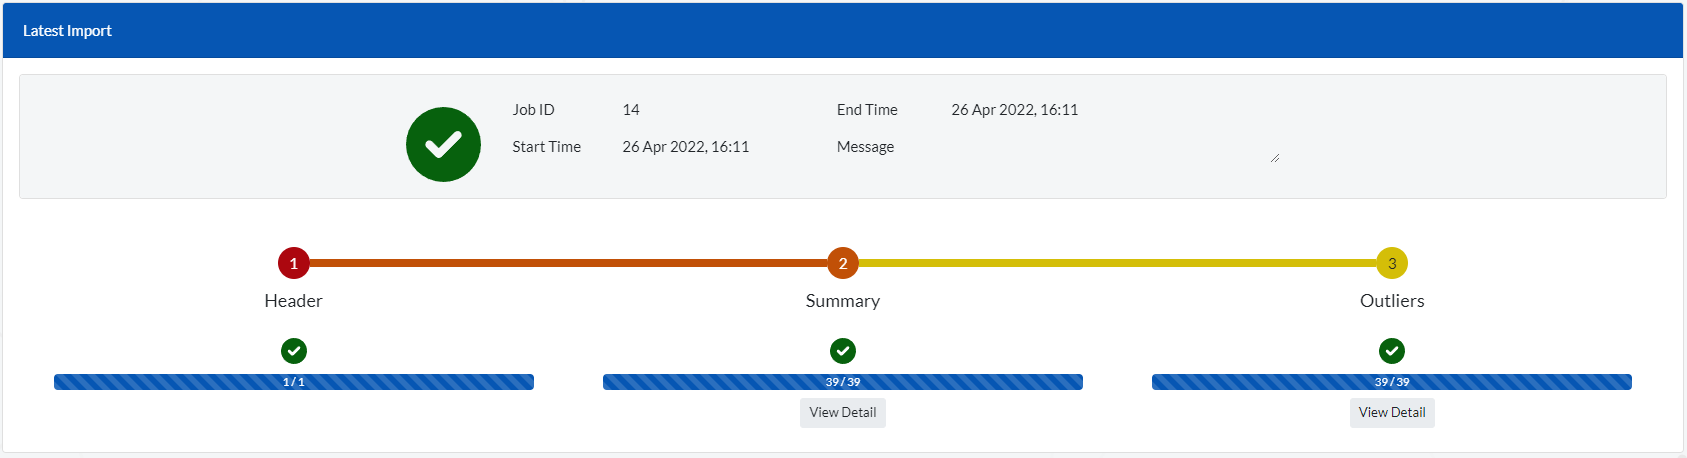
This window shows the status of the latest job or whichever job is currently selected. It indicates if the (Header, Summary, Outliers) stages of the job have run successfully. If there is an error in any of the stages a cross (‘x’) will be displayed instead of a tick. For the Summary and Outlier stages you can click on the ‘View Detail’ button below them to get more information on that stage.
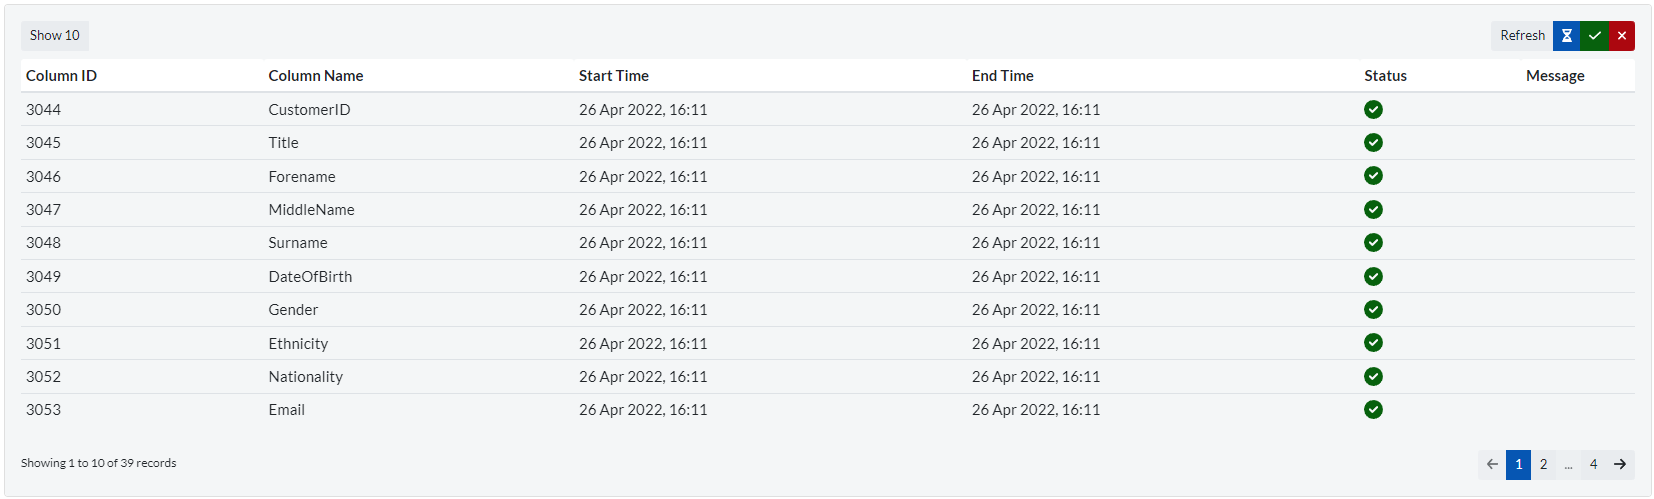
Window displaying more information on the Summary or Outlier stage of a particular profiling job after the ‘View Detail’ button has been clicked.
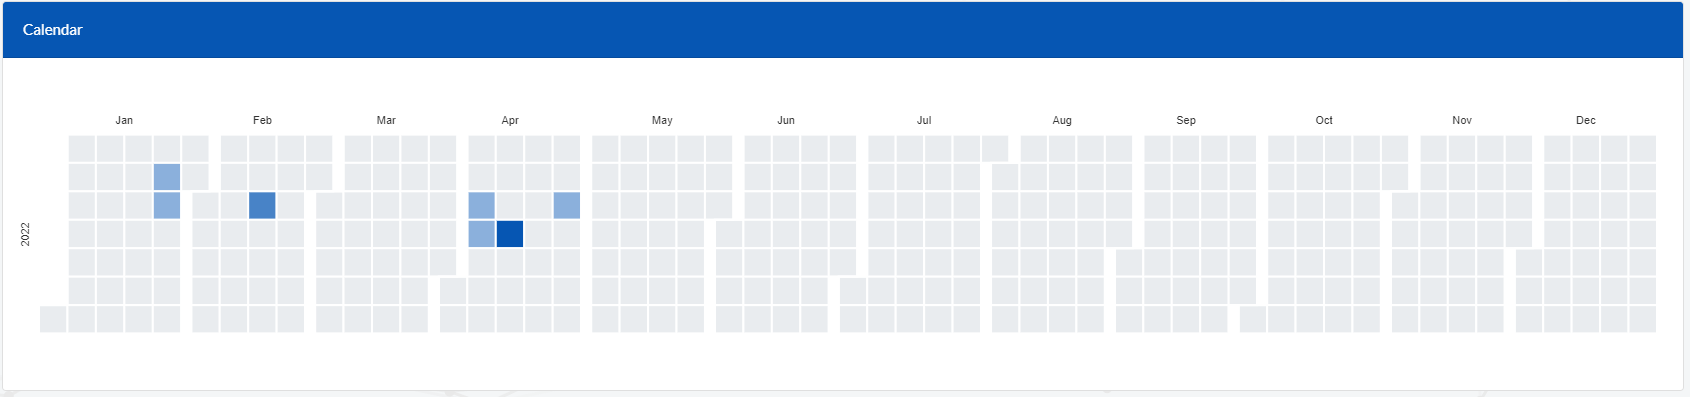
The calendar window highlights the days of the month in which Profiling jobs were run. Each block within a month represents a day. The intensity of the colors on the blocks (days) depends on how many jobs were run on that particular day. The more intense the color, the more number of jobs were run on that day
This is the section that displays the evaluation of each column after the profiling job has been set up and run.
To start, Select the System and Table (Shown in the window below).
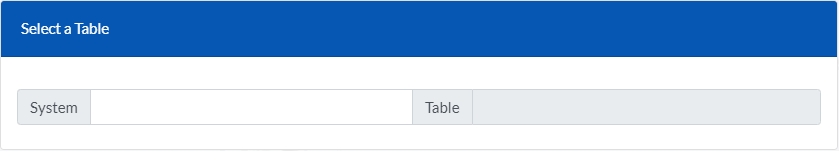
After the System and Table have been selected, the screens below will appear. They include:
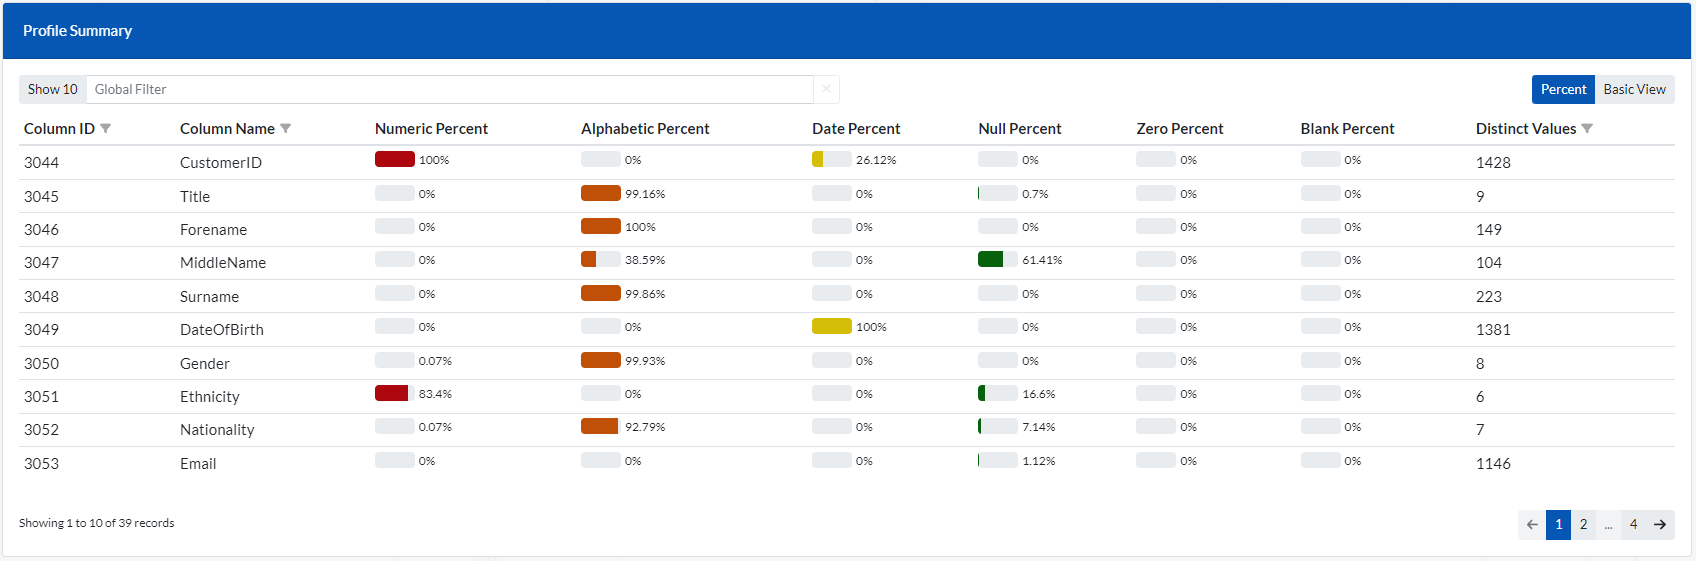
After you click/select a particular row in the profile summary window (above), several windows/charts will appear displaying some further analysis of the selected item. These include:
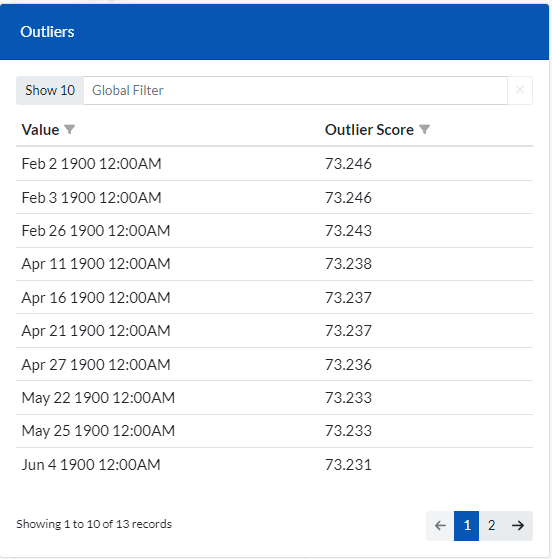
A window displaying the Outliers items found and their Outlier score. If no outliers are found in the selected column, this screen will be empty with the message ‘No data to display’
To filter to a specific outlier item, simply enter the item in the ‘Global Filter’ section.
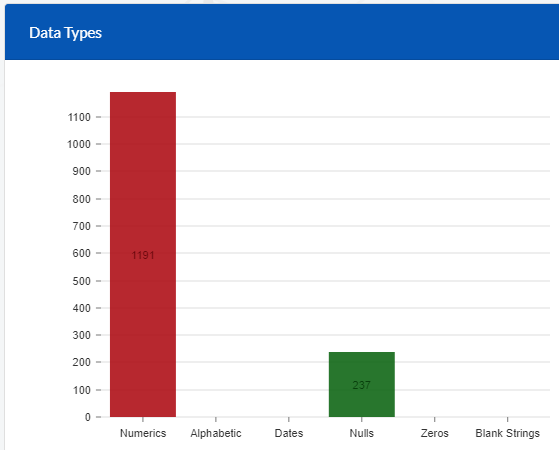
The chart displays the split of datatypes in the selected item (column).
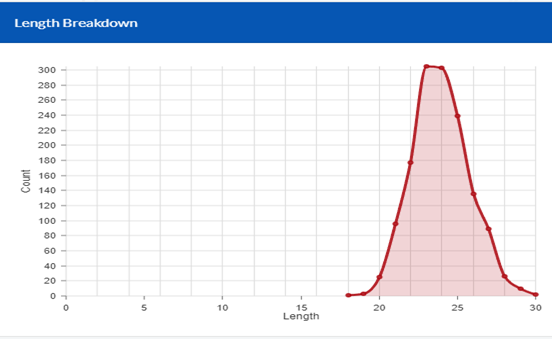
A chart that displays a breakdown of the length for the values found in the column.
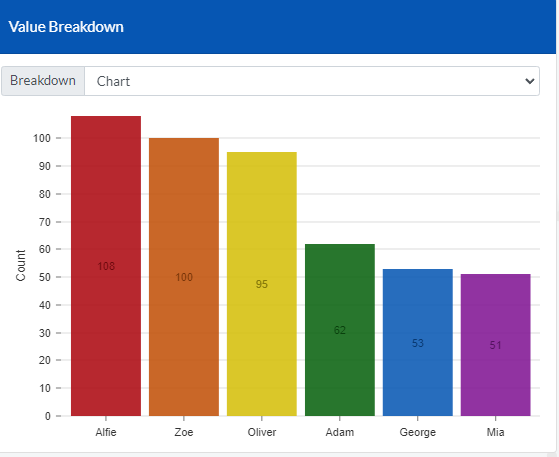
A chart/table displaying the split of values in the selected column. It only applies to categorical columns (columns with limited number of values).
To switch to table view simply click on the drop down list next to the ‘Breakdown’ label.
This section enables the user to view the raw dataset directly. Before the user can access this section, they have to be assigned rights by an Admin user. These rights are set in the MetaData > Systems area.
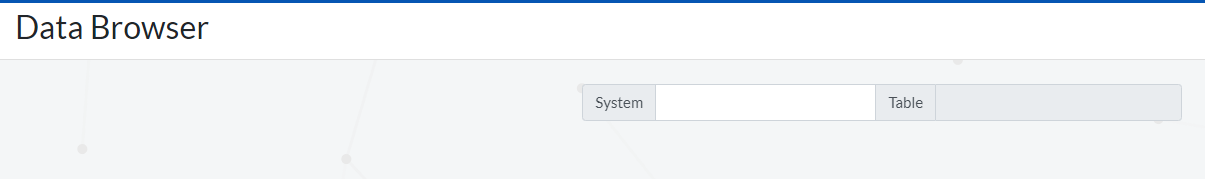
Go to (Profiling > Data Browser).
Enter the system and table that you would like to access in the window below.
You will be presented with a view of your actual data as shown in the window below.
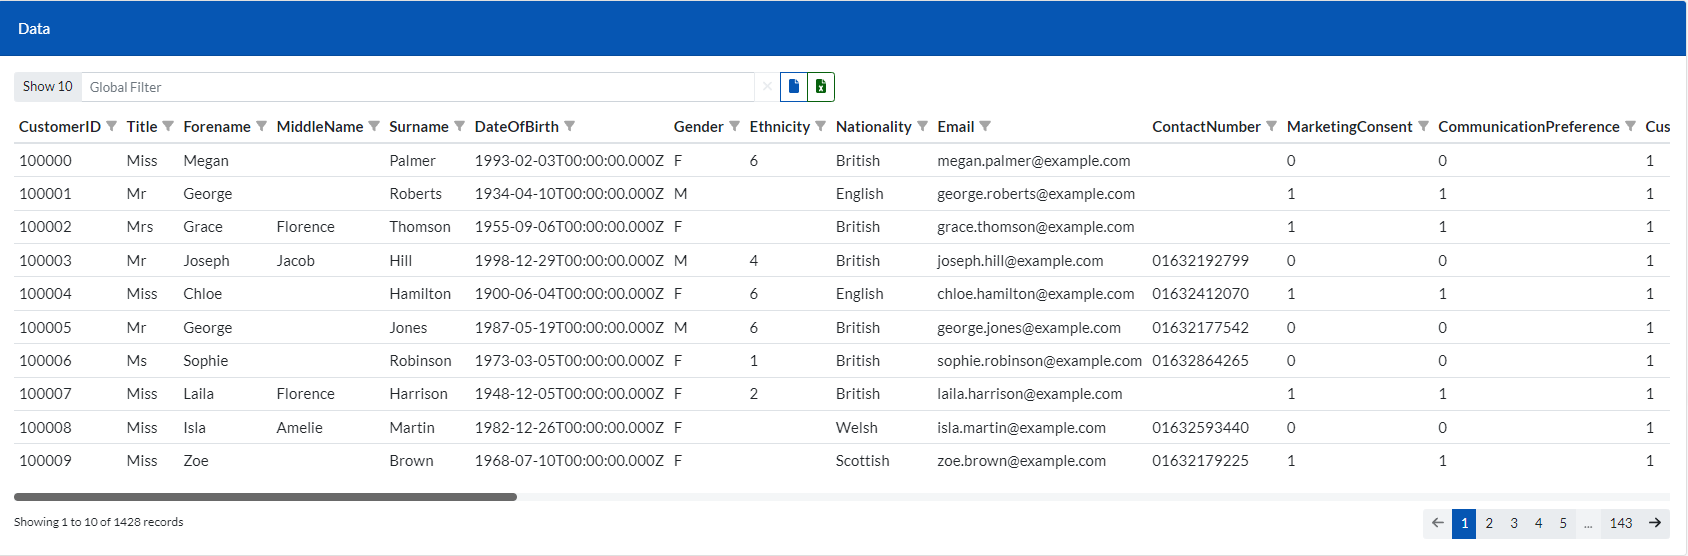
When viewing the dataset in the above window, you can sort by (ascending or descending) by clicking on any column. You can also filter on any column by simply clicking the filter icon next to each column title.
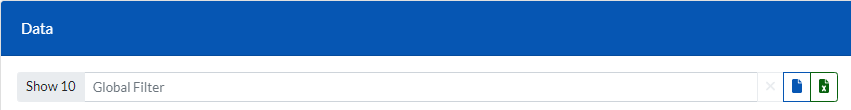
Use the ‘Global filter’ input box to filter to specific records.
Set the number of records to display on a single page by clicking on the ‘Show 10’ label. It is set to display 10 records per page by default.
Clicking on the CSV & Excel icons downloads the dataset to the required format.