The Catalog provides visualizations to help users understand how items relate to one another and how information moves between them.
This functionality is primarily used to:
To access the data model diagram, select the Visualize tile in the Data model section of the home page. The diagram presents your organization's data model as a network of nodes and connecting lines.
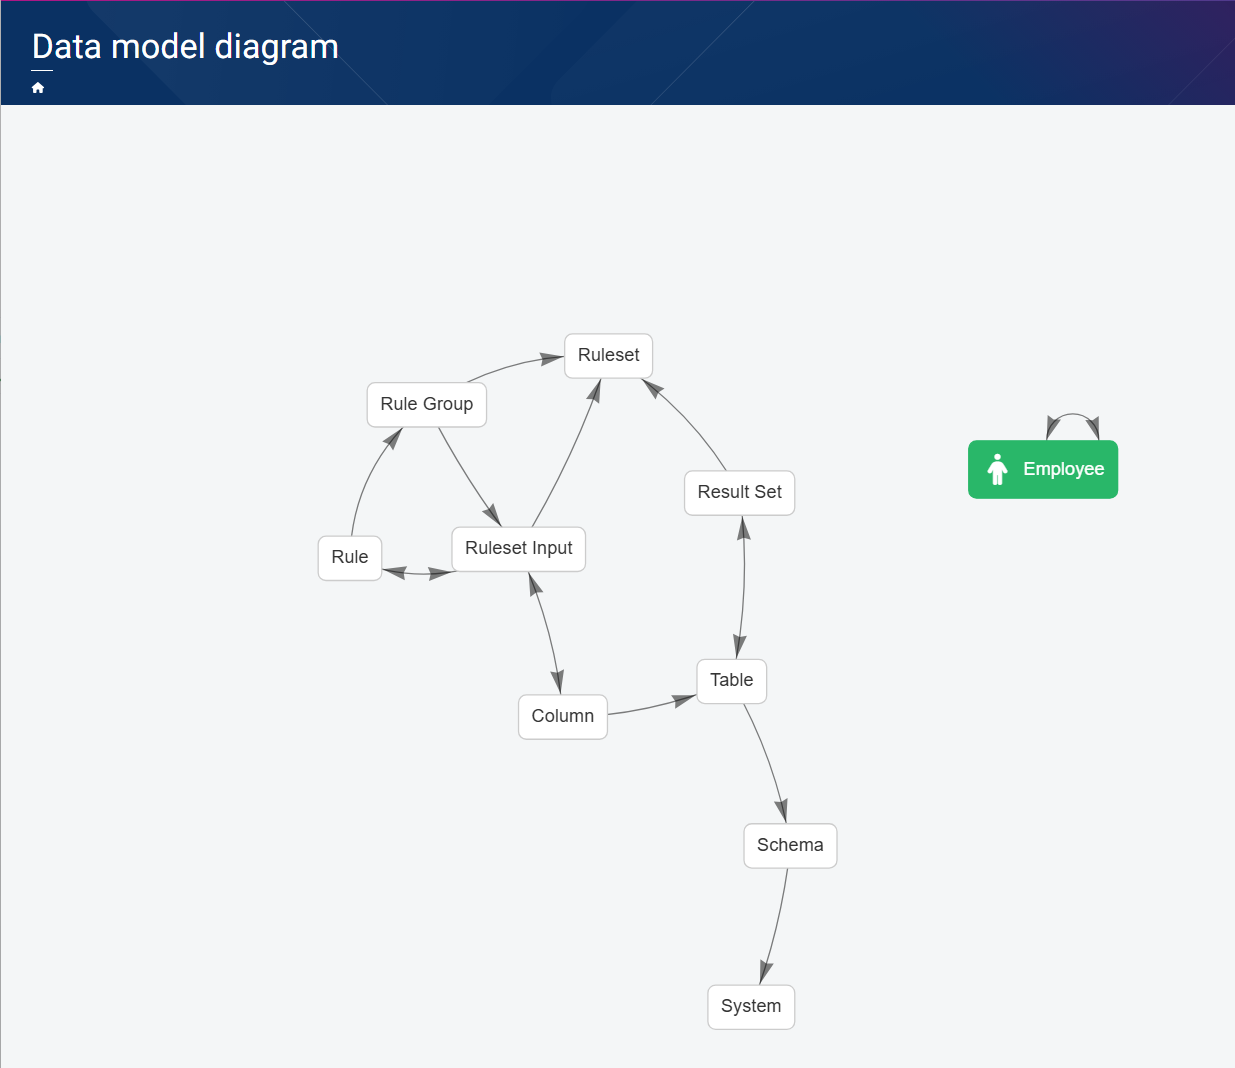
Associations shown include:
The model view is interactive and supports exploratory analysis. You can:
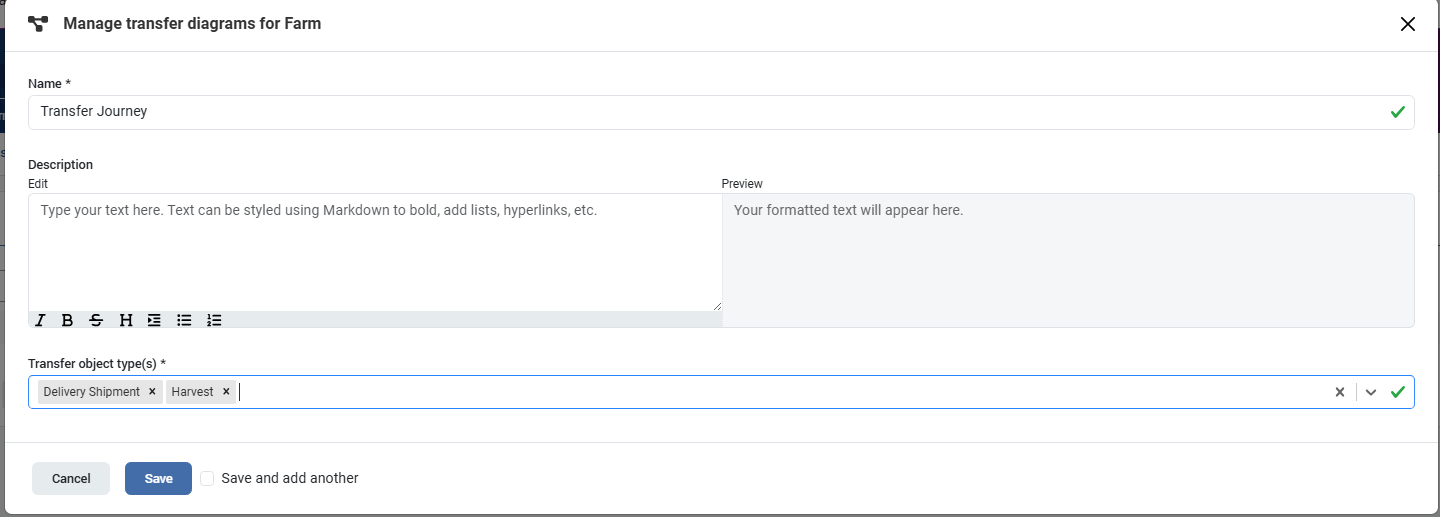
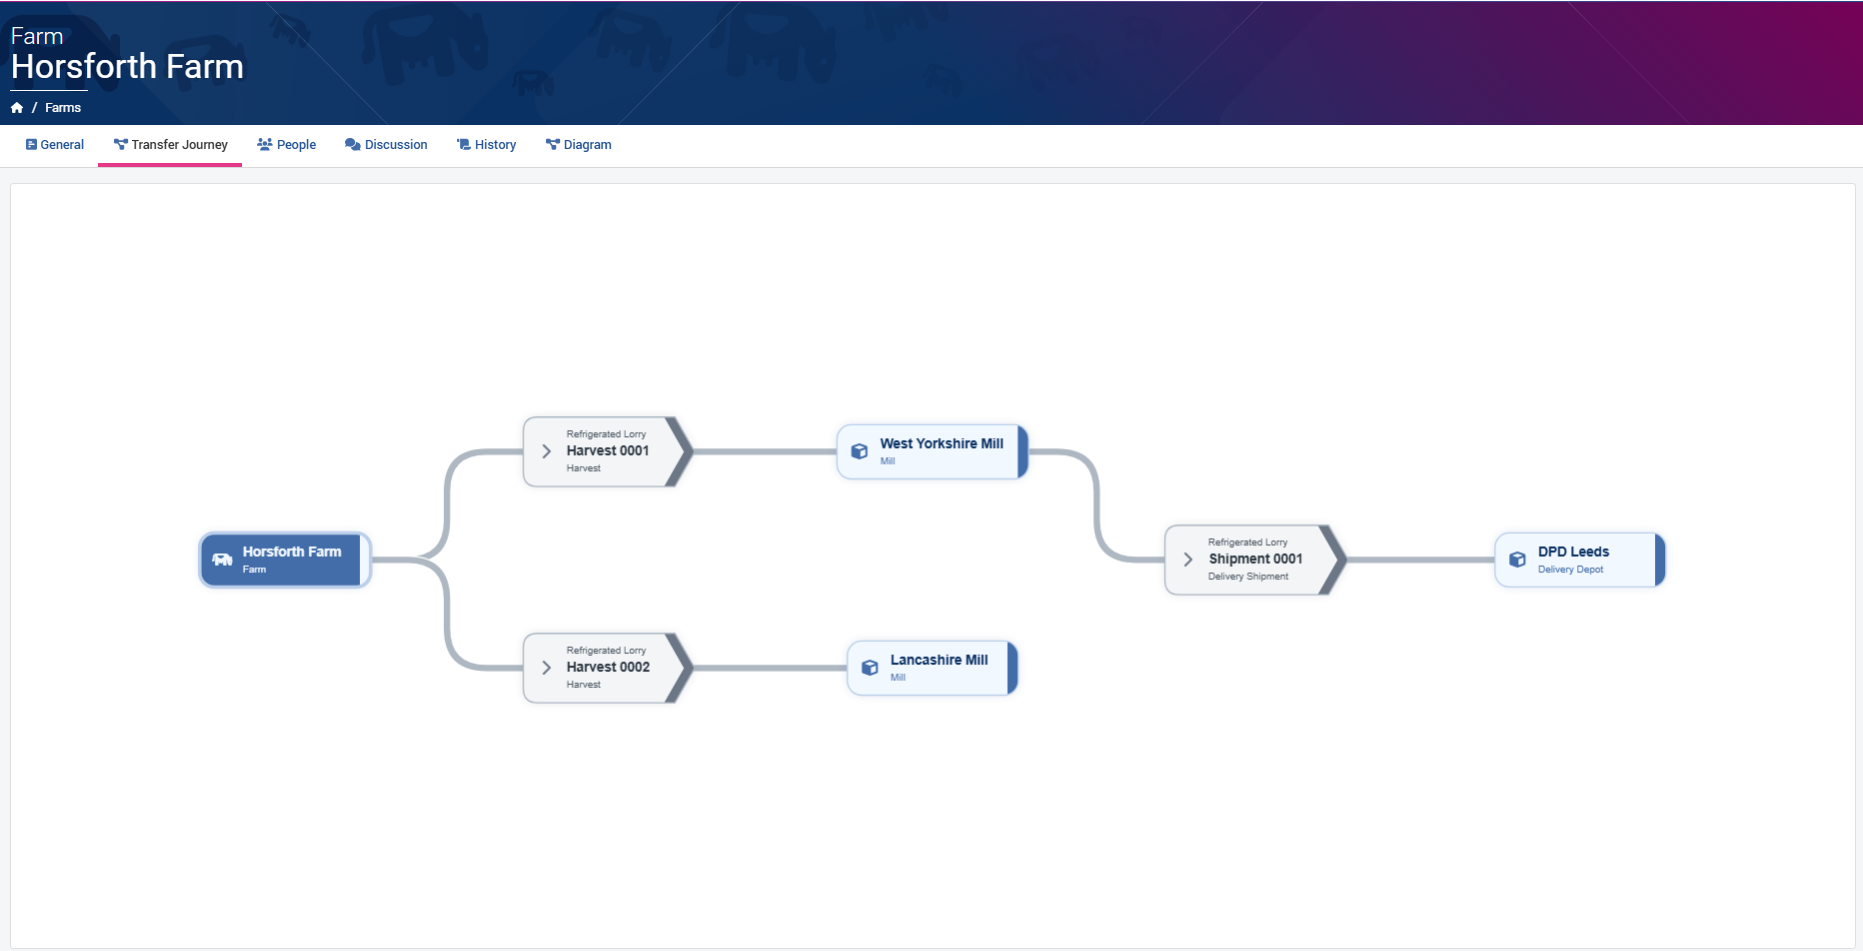
A Transfer diagram is a visualization of an end-to-end transfer process — how something physical, electronic, or informational moves between objects across an organization. It is built from Detailed Association Types (DATs) that a Catalog admin has grouped together.
Before a Transfer diagram can show anything useful, the underlying Detailed Association Types need to be set up alongside the instance level records.
Detailed Association Types are configured in the Data model maintenance area. See Catalog administration for details on setting up Detailed Association Types.
Under the hood, a Transfer diagram isn't one global diagram — it's a diagram definition configured against a specific Object Type, on that type's own Transfer diagrams tab. An admin names the definition and selects which Detailed Association Types should be included, which is what actually defines the upstream and downstream paths the diagram is allowed to traverse. When a user opens the diagram from a real object record, that object becomes the starting point, and the system walks outward through the selected DATs' Source links (upstream) and Target links (downstream) to build the connected nodes and edges shown.