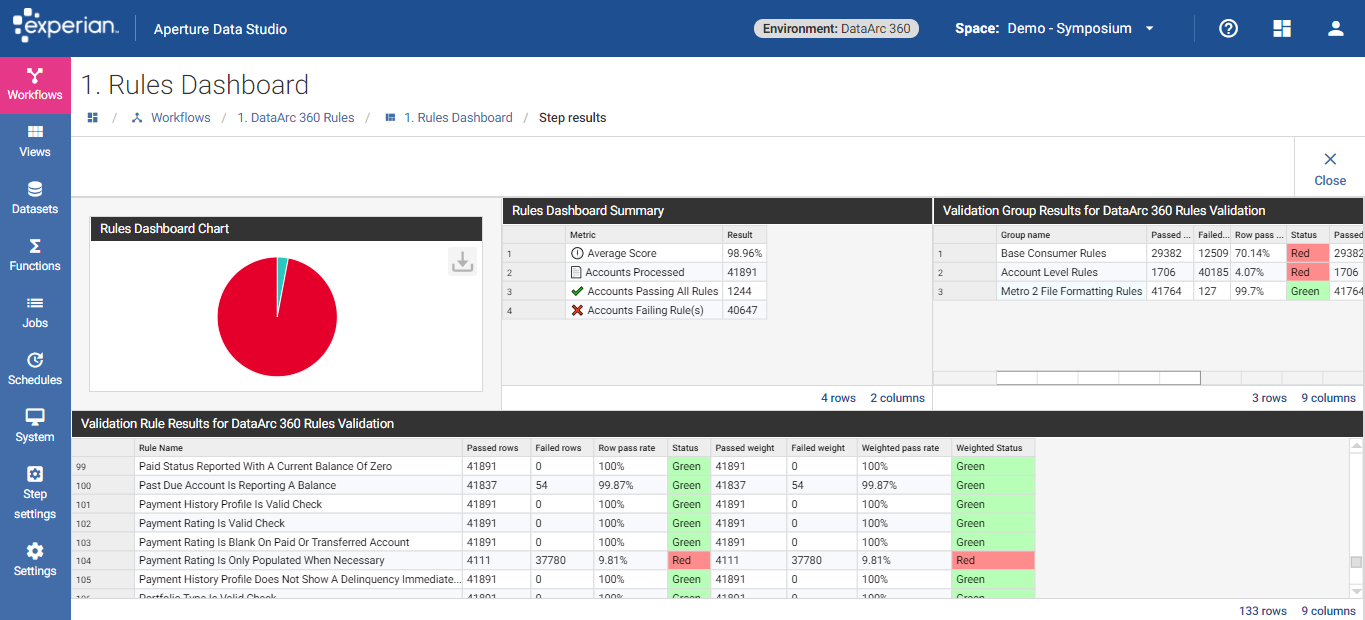
Once the data is mapped, you can execute the DataArc 360™ Rules Dashboards to see the rule results. After execution is complete, various dashboards will be populated.
The first type of Dashboard displays rule results at an aggregate overview level. Here's an example of this report:
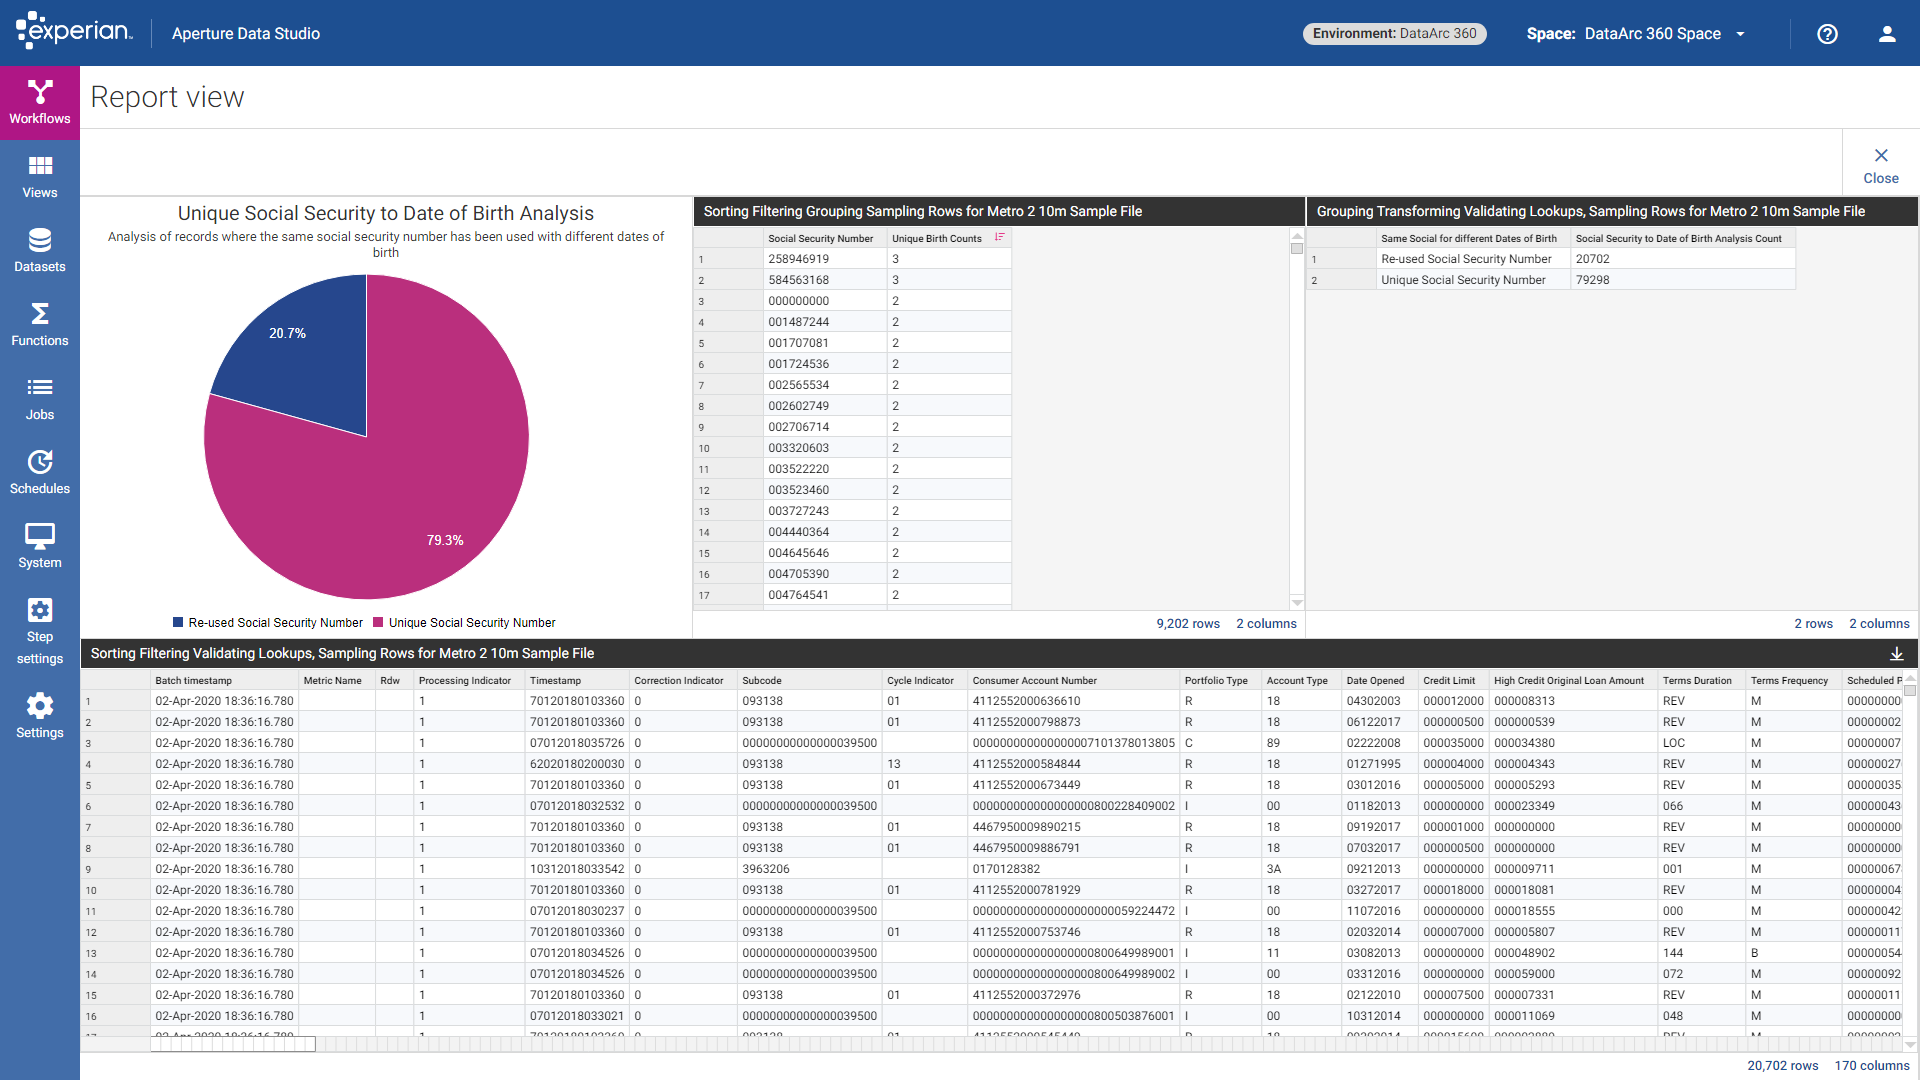
This second report type provides more detail on specific rules and records. In this example we're showing unique vs re-used social security numbers (you can re-use this as a template for any other validation rule):
Specific users can be given access to different reports and even different level of permissions, preventing them from making modifications or seeing the underlying data.
For users who should only be able to view reports (and not be able to modify/re-run reports or explore the Datasets), we recommend assigning Data Consumer role for a robust security model.
Data Studio also provides a Profiling option. To use this open the Dataset you want to Profile, click Explore and then choose "Profile", and choose which columns you would like to profile. The output looks as follows:
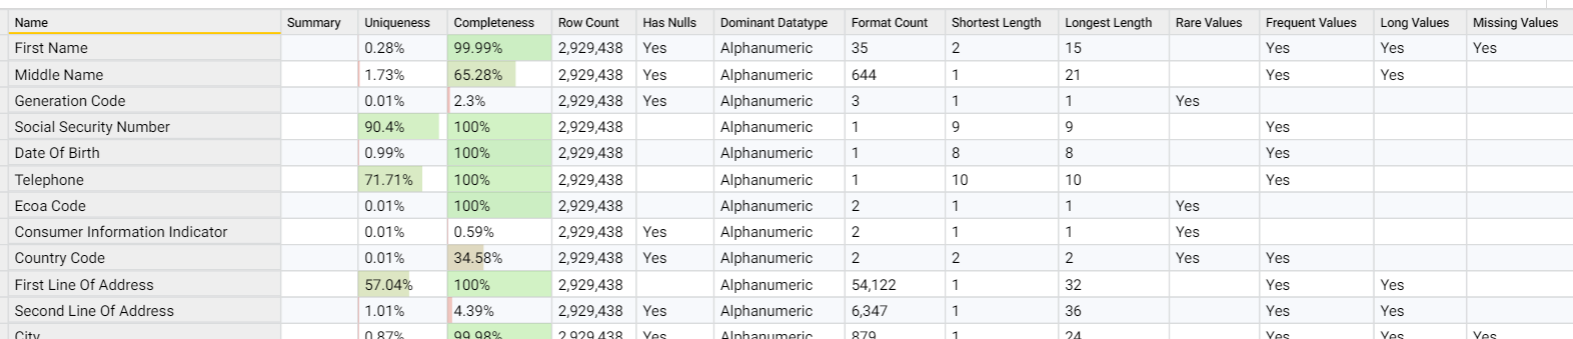
From this you can analyze the overall content of your columns and look for red flags (such as non-unique Social Security numbers). Rare, Frequent, and Long values can also help identify the possibility of outliers in these columns. In the case that these are "Yes", we recommend to look further into the data to identify the outlier columns.