The Data model visualization illustrates the relationships and dependencies between Object Types in the Catalog.
This functionality is primarily used to:
Understand Object Type associations and dependencies
Analyze how data is transferred or transformed
Support impact analysis when making model changes
Assist with troubleshooting and design reviews
Identify 'orphaned' Object Types that are not connected to others
Access the data model visualization by selecting the Visualize tile in the General section of the home page.
Data model view
The central area presents the data model as a network of nodes and connecting lines.
- Each node, or tile, represents an Object Type within the data model
- Connecting lines show how Object Types are related through their configured associations
- Directional arrows indicate the flow or direction of each association
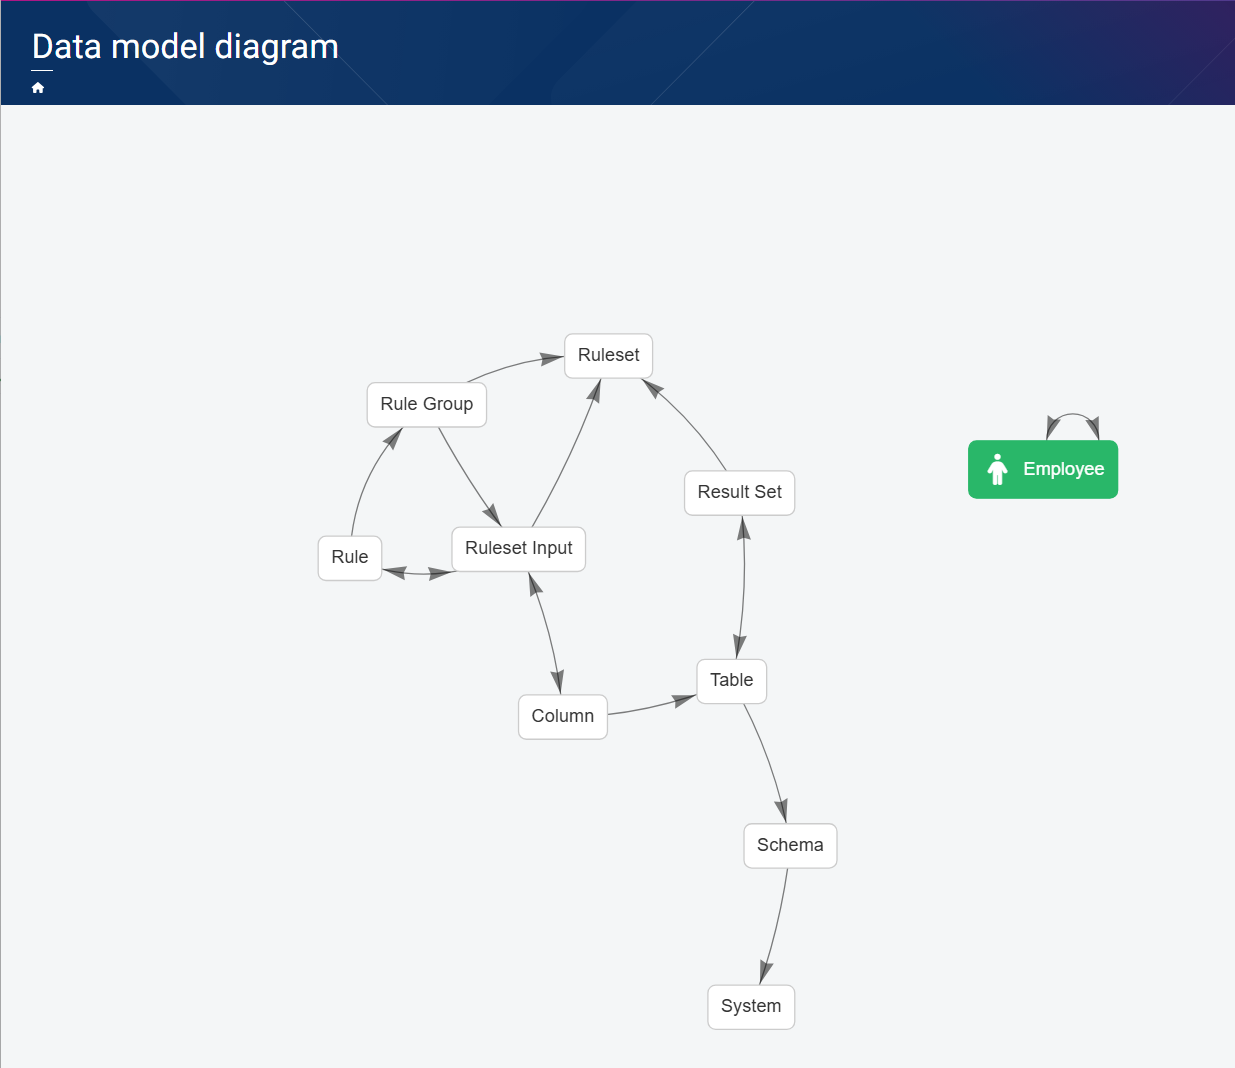
Associations shown include:
- One-to-many associations – for example, a Ruleset contains multiple Rule Groups, and Rule Groups contain multiple Rules
- Many‑to‑many associations – for example, a Rule can be linked to multiple Ruleset Inputs, and a Ruleset Input can be linked to multiple Rules
- Self‑referencing associations – for example, an employee can be the manager of another employee
Viewing and exploring relationships
The model view is interactive and supports exploratory analysis. You can:
- Pan across the view to navigate large or complex models
- Zoom in and out to focus on specific Object Types or associations
- Click an Object Type tile to display all related objects
- Hover over a connector to view the association name